
B2B marketing ROI for manufacturers isn't measured the same way you'd track a quick ecommerce sale.
Your typical customer doesn't see a Facebook ad at breakfast and buy a $50,000 CNC machine by lunch.
The measurement framework needs to account for 130-day average sales cycles, multiple decision-makers, and touchpoints that span months.
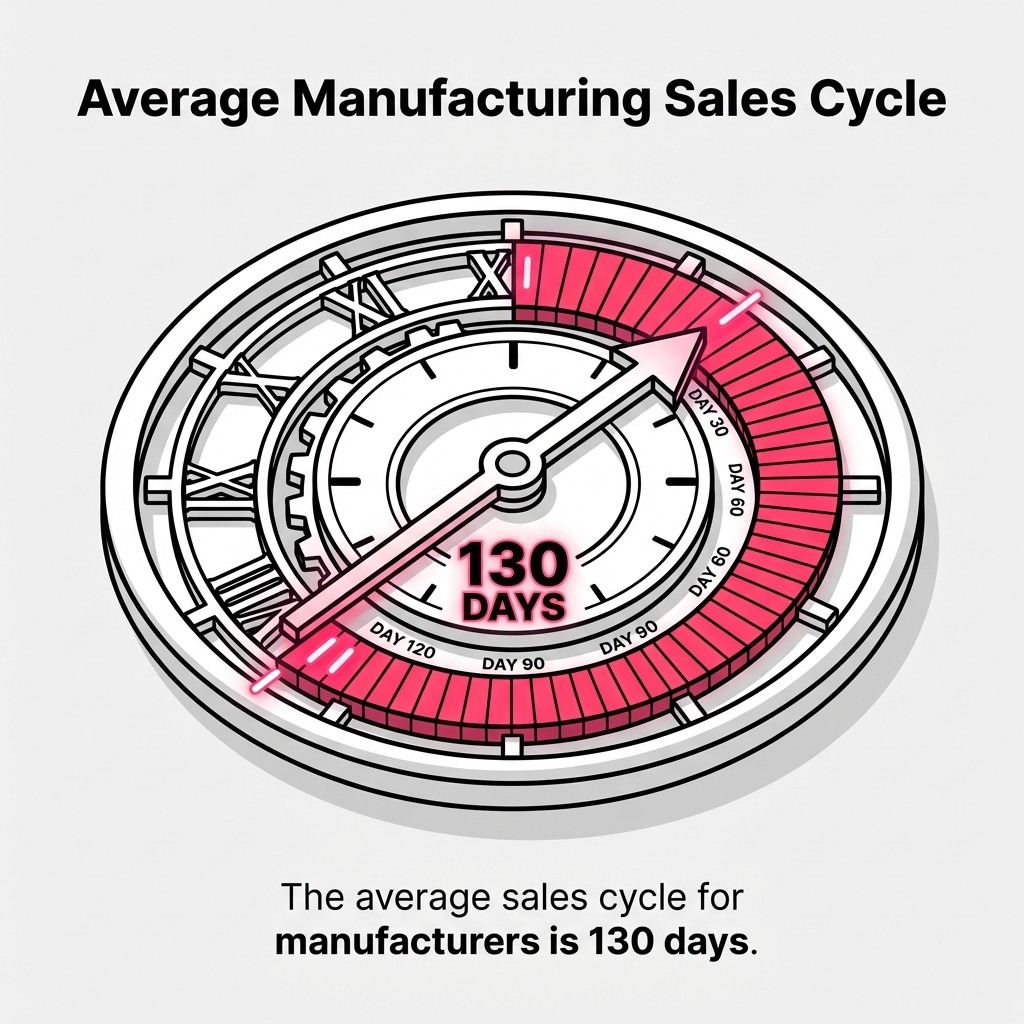
Manufacturing sales cycles average 130 days—align measurement windows and attribution with this reality.
I've worked with manufacturers who obsess over last-click attribution while ignoring the webinar that started the conversation six weeks earlier. That's like crediting only the final bolt for holding together an entire assembly.
The real question isn't whether your marketing works. It's whether you're measuring what actually matters for your business.
Manufacturing companies face unique ROI challenges. Your prospects research extensively before engaging. They attend trade shows, download technical specifications, consult with engineers, and revisit your content multiple times. A simple revenue-divided-by-spend formula misses the complexity entirely.
This guide shows you how to measure B2B marketing ROI in a way that reflects manufacturing realities. You'll learn which attribution models work for long sales cycles, how to calculate customer lifetime value for industrial buyers, and which channel benchmarks matter for your industry. We'll cover the formulas, the frameworks, and the practical metrics that help you optimize your marketing investment.
Marketing ROI tells you whether your marketing investment generates more money than it costs. The basic formula looks simple: subtract your marketing investment from the revenue it generated, divide by the investment, then multiply by 100 for a percentage.
Here's where manufacturers get tripped up. That "revenue it generated" part requires you to know which marketing touchpoints influenced which deals. When your sales cycle spans months and involves multiple stakeholders, attribution gets complicated fast.
The standard ROI formula is: ((Revenue - Marketing Investment) / Marketing Investment) × 100.
If you spent $50,000 on marketing and generated $200,000 in attributed revenue, your calculation would be: (($200,000 - $50,000) / $50,000) × 100 = 300% ROI.
That 300% sounds great until you realize you're only counting deals where marketing got last-touch credit. What about the prospects who attended your trade show booth, downloaded three whitepapers, and attended a webinar before the sales team closed them?
Your marketing investment isn't just ad spend. It includes salaries for your marketing team, software subscriptions for your marketing automation platform and CRM, agency fees, content creation costs, trade show expenses, and overhead allocation.
Most manufacturers I work with underestimate their true marketing costs by 30-40% because they forget to include fully-loaded employee costs or amortized software expenses.
Track these components separately: personnel costs, technology and tools, paid advertising, content production, events and trade shows, and overhead allocation.
Revenue attribution assigns credit to the marketing activities that influenced a purchase. For manufacturers, this gets complex because your buyers don't follow linear paths.
A maintenance manager might download a technical spec sheet in January, attend your webinar in February, visit your booth at a trade show in March, and finally request a quote in April. Which touchpoint deserves credit for that $150,000 equipment purchase?
The answer depends on your attribution model, which we'll cover in detail later. For now, understand that your choice of attribution model dramatically affects your calculated marketing ROI.
Manufacturing marketing budgets are under scrutiny. According to recent B2B marketing budget benchmarks, manufacturers typically allocate 3-6% of revenue to marketing, and that percentage is trending upward.
When you're investing hundreds of thousands of dollars annually, leadership wants proof it's working. "We got some leads" doesn't cut it anymore.
Proper ROI measurement helps you justify your budget, identify which channels deserve more investment, eliminate wasteful spending, optimize your marketing mix, and forecast future revenue based on marketing activity.
Without accurate ROI measurement, you're making decisions based on hunches. I've seen manufacturers pour money into trade shows that cost $112 per contact while ignoring digital channels that deliver qualified leads at a fraction of that cost.

Average trade show lead costs are about $112 per contact—track conversion and pipeline impact to validate spend.
The problem isn't the trade show itself. It's not knowing whether those $112 contacts actually convert to customers at a rate that justifies the investment.
Measurement eliminates guesswork. It tells you which marketing activities generate pipeline, which channels deliver the lowest customer acquisition cost, how long it takes for marketing to generate positive returns, and where to cut spending without hurting results.
Manufacturers face specific obstacles that don't affect B2C companies or even other B2B industries. Understanding these challenges helps you build measurement systems that actually work.
Your marketing campaign might run in Q1 while the deals it influenced close in Q3 or Q4. Standard monthly or quarterly reporting makes your early-stage efforts look ineffective.
Time-lag reporting solves this. Track when prospects first engaged with marketing and when they eventually closed. This reveals your true marketing-to-close timeline.
Build a cohort analysis that groups prospects by their first marketing touchpoint month, then tracks their progression through your pipeline over subsequent months.
Manufacturing purchases typically involve engineering, operations, procurement, and executive leadership. Each stakeholder consumes different content at different times.
Your engineer might engage with technical specifications while the CFO downloads ROI calculators and the operations manager attends product demos. Single-person attribution models miss this reality entirely.
Account-based measurement works better for complex B2B sales. Track all touchpoints across all contacts within a target account, then attribute revenue at the account level rather than the individual level.
Trade shows, sales meetings, phone calls, and direct mail don't automatically integrate with your marketing analytics. These offline interactions influence deals but often go unmeasured.
Close the loop by implementing lead source tracking in your CRM, using unique phone numbers for different campaigns, creating campaign-specific landing pages for offline promotions, and training sales teams to log all prospect interactions.
Accurate ROI measurement requires the right data infrastructure. You can't calculate returns if you don't know what you spent or which marketing activities influenced which deals.
Your marketing automation platform tracks prospect engagement while your CRM tracks deals and revenue. These systems must share data bidirectionally.
Integration enables you to see which marketing campaigns generated which opportunities, track prospect engagement throughout the sales cycle, and calculate revenue per campaign, channel, and content type.
Popular integrations include Salesforce with Pardot or Marketo, HubSpot with HubSpot CRM, and Zoho CRM with Zoho Marketing Automation (which delivers 245-610% ROI for manufacturers according to implementation case studies).
UTM parameters are tags you add to your URLs that identify the source, medium, campaign, and content that drove traffic. They're essential for digital attribution.
Every link in every email, social post, and paid ad should include UTM parameters. This lets you trace website visitors back to specific campaigns.
Use consistent naming conventions: utm_source identifies where traffic originated (linkedin, email, google), utm_medium identifies the channel type (social, email, cpc), utm_campaign identifies the specific campaign (q2-product-launch), and utm_content differentiates variations (button-blue vs button-red).
Your CRM must track which marketing campaigns influenced each opportunity. This requires sales teams to consistently log campaign attribution data.
Create custom fields in your CRM for first marketing touchpoint, all marketing touchpoints, lead source campaign, and marketing-influenced opportunity (yes/no flag).
Train your sales team to verify and update this information as they qualify leads. Incentivize accuracy by sharing marketing ROI reports that show which campaigns deliver the best opportunities.
This framework gives you a practical process for calculating ROI that reflects manufacturing realities. Start with the basics and add complexity as your measurement capabilities mature.
Choose a timeframe that matches your sales cycle. For manufacturers with 130-day average cycles, monthly measurement creates misleading results.
Quarterly or annual measurement provides more accurate pictures. You can also use rolling 12-month windows that update monthly.
Track your average time from marketing qualified lead to closed deal. Use that duration as your minimum measurement period.
Add up all marketing expenses for your measurement period. Include personnel (salaries plus benefits for marketing team members), technology (CRM, marketing automation, analytics, design tools), paid media (search ads, social ads, display, retargeting), content creation (writers, designers, video production), events (trade shows, conferences, webinars), and overhead (office space allocation, equipment, training).
Don't forget partially-allocated costs. If your marketing team uses 30% of a sales enablement tool, include 30% of that subscription cost.
Pull a report from your CRM showing all closed-won deals during your measurement period where marketing had any touchpoint. This is your marketing-influenced revenue.
For more sophisticated measurement, separate first-touch influenced revenue (marketing started the relationship) from multi-touch influenced revenue (marketing contributed anywhere in the journey).
Compare these numbers. If first-touch revenue is significantly lower than multi-touch revenue, your marketing plays an important supporting role even when it doesn't generate the initial lead.
Choose an attribution model that reflects how your marketing actually works. We'll cover specific models in the next section, but understand that your choice affects your calculated ROI.
Last-touch attribution gives all credit to the final marketing touchpoint before a deal closes. First-touch attribution credits the initial touchpoint that started the relationship. Linear attribution distributes credit equally across all touchpoints.
Start with first-touch attribution to understand marketing's role in demand generation, then layer in multi-touch models as you gain sophistication.
Use the standard formula: ((Attributed Revenue - Marketing Investment) / Marketing Investment) × 100.
If your attributed revenue was $2 million, your marketing investment was $180,000, and you're using first-touch attribution, your calculation would be: (($2,000,000 - $180,000) / $180,000) × 100 = 1,011% ROI.
Document your attribution model clearly. "1,011% ROI using first-touch attribution" communicates much more accurately than just "1,011% ROI."
Customer acquisition cost (CAC) tells you how much you spend to acquire each new customer. Divide your total marketing investment by the number of new customers acquired.
If you spent $180,000 and acquired 36 new customers, your CAC is $5,000 per customer.
Track CAC by channel to identify which sources deliver customers most efficiently. Your trade show CAC might be $12,000 while your content marketing CAC is $3,500.
Customer lifetime value (LTV or CLV) estimates the total revenue you'll generate from a customer over your entire relationship. For manufacturers with recurring spare parts sales or service contracts, LTV can be substantially higher than initial purchase value.
A basic LTV formula: (Average Purchase Value) × (Average Purchase Frequency) × (Average Customer Lifespan).
If customers typically make a $50,000 initial purchase, buy $15,000 in parts annually, and maintain relationships for eight years, their LTV is $50,000 + ($15,000 × 8) = $170,000.
Compare LTV to CAC. A healthy ratio is 3:1 or higher. If your LTV is $170,000 and your CAC is $5,000, your ratio is 34:1, which suggests you could profitably invest more in customer acquisition.
Attribution models determine how you assign credit for revenue across multiple marketing touchpoints. Your choice dramatically affects your calculated marketing ROI.
Manufacturers need attribution models that reflect reality: prospects engage with multiple touchpoints over extended periods before purchasing.
First-touch attribution gives 100% of the credit to the initial marketing touchpoint that brought a prospect into your system. If someone downloaded a whitepaper and eventually became a customer, that whitepaper gets full credit.
This model helps you understand which channels and campaigns generate new awareness and start relationships. It's useful for measuring top-of-funnel effectiveness.
The limitation: it ignores all the nurturing, education, and persuasion that happened between first touch and purchase. For manufacturers with long sales cycles, this is a significant blind spot.
Last-touch attribution assigns 100% credit to the final marketing touchpoint before a deal closes. If the last interaction was a product demo registration, that demo gets all the credit.
This model shows which activities directly precede purchases. It's useful for understanding what pushes prospects over the finish line.
The problem: it completely ignores awareness and consideration activities. The webinar that educated the prospect six weeks ago gets zero credit, even though it was essential to the sale.
Linear attribution distributes credit equally across all documented touchpoints. If a prospect had 10 marketing interactions before purchasing, each touchpoint receives 10% of the credit.
This model recognizes that multiple touchpoints contribute to sales. It's significantly more accurate than first-touch or last-touch for complex B2B sales.
The limitation: it assumes all touchpoints are equally valuable. The detailed product comparison guide probably had more impact than the promotional email, but linear attribution treats them identically.
Time-decay attribution gives more credit to recent touchpoints while still acknowledging earlier interactions. Touchpoints closer to the purchase decision receive higher weighting.
A common approach assigns 50% credit to touchpoints in the final 30 days, 30% to touchpoints in the previous 30 days, and 20% to all earlier touchpoints.
This model reflects the reality that recent interactions often have more influence on purchase decisions. It works well for manufacturers where late-stage product evaluations heavily influence final choices.
U-shaped attribution assigns 40% credit to the first touchpoint, 40% to the last touchpoint, and distributes the remaining 20% across all middle touchpoints.
This model recognizes that initiating a relationship and closing a sale are both critical, while still acknowledging the importance of nurturing activities.
For manufacturers, U-shaped attribution often provides a balanced view that credits both awareness generation and deal acceleration.
W-shaped attribution adds a third major touchpoint: the point where a lead becomes marketing qualified. It assigns 30% credit to first touch, 30% to the MQL conversion touchpoint, 30% to last touch, and distributes the remaining 10% across other interactions.
This model works well when you have a clear definition of marketing qualified leads and can identify the specific touchpoint that moved a prospect across that threshold.
If your content strategy focuses on educating buyers through detailed technical content, W-shaped attribution helps you measure the effectiveness of those educational assets.
Start with first-touch attribution to understand demand generation effectiveness. Add last-touch to see what closes deals. Then implement linear or time-decay multi-touch attribution as your tracking improves.
The best model depends on your sales process. If late-stage product demos heavily influence decisions, time-decay makes sense. If initial awareness and final conversion matter most, try U-shaped attribution.
Don't switch models constantly. Pick one, use it consistently for at least two sales cycles, and then evaluate whether a different model might provide better insights.
Different marketing channels deliver different returns. Understanding channel-specific benchmarks helps you set realistic expectations and identify underperforming investments.
Email remains one of the highest-ROI channels for B2B manufacturers. According to B2B digital marketing benchmarks, email marketing delivers $36-$45 for every $1 invested.
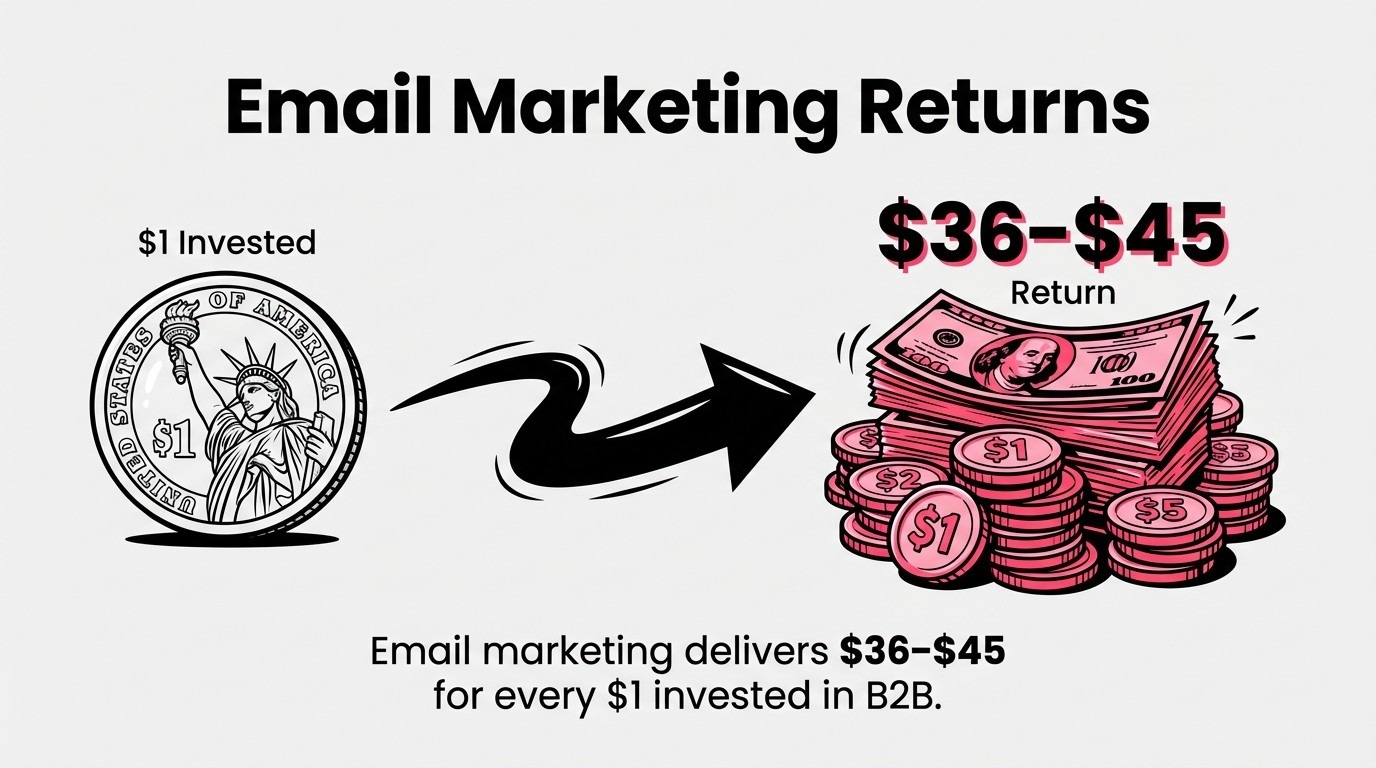
B2B email marketing typically returns $36–$45 per $1 invested—still a top-performing channel for manufacturers.
Manufacturing email campaigns typically see lower open rates than B2C (15-20% is solid) but higher average deal values. 66% of email marketers rate their ROI as excellent or good, making it a proven channel for industrial companies.
Focus on segmented campaigns that address specific prospect needs. Generic promotional emails underperform, while targeted technical content drives engagement and conversions.
Search engine optimization delivers exceptional long-term ROI for manufacturers. Research shows SEO can generate 748% ROI over multi-year periods as your content library compounds.
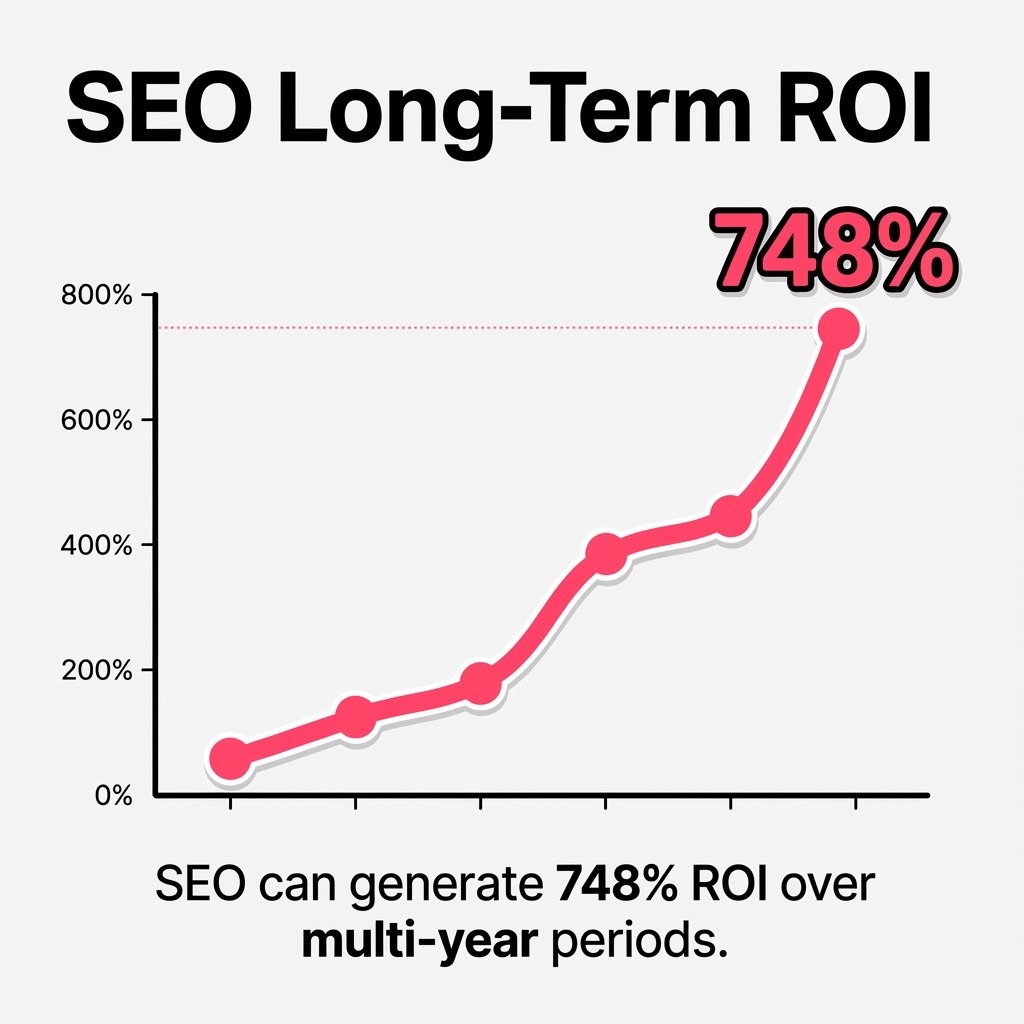
SEO compounds over time—up to 748% ROI across multi-year horizons—so measure it on annual windows.
The challenge: SEO requires 6-12 months before showing significant results. You're investing in content creation, technical optimization, and link building while revenue impact lags.
Measure SEO ROI over annual periods minimum. Track organic traffic growth, ranking improvements for target keywords, and leads generated from organic search as leading indicators.
Pay-per-click advertising on Google and Bing provides immediate visibility for high-intent searches. Manufacturing keywords often have lower competition than consumer categories, resulting in reasonable costs per click.
Track ROAS (return on ad spend) separately from overall marketing ROI. ROAS measures revenue generated per dollar of ad spend, typically calculated as: (Revenue from Ads / Ad Spend) × 100.
A ROAS of 400% means you generated $4 in revenue for every $1 spent on ads. For manufacturers, ROAS between 300-600% is typical for well-optimized campaigns. Learn more about optimizing Google Ads for maximum ROI.
Account-based marketing (ABM) targets specific high-value accounts with personalized campaigns. For manufacturers, ABM effectiveness shows 84% pipeline growth when implemented consistently.
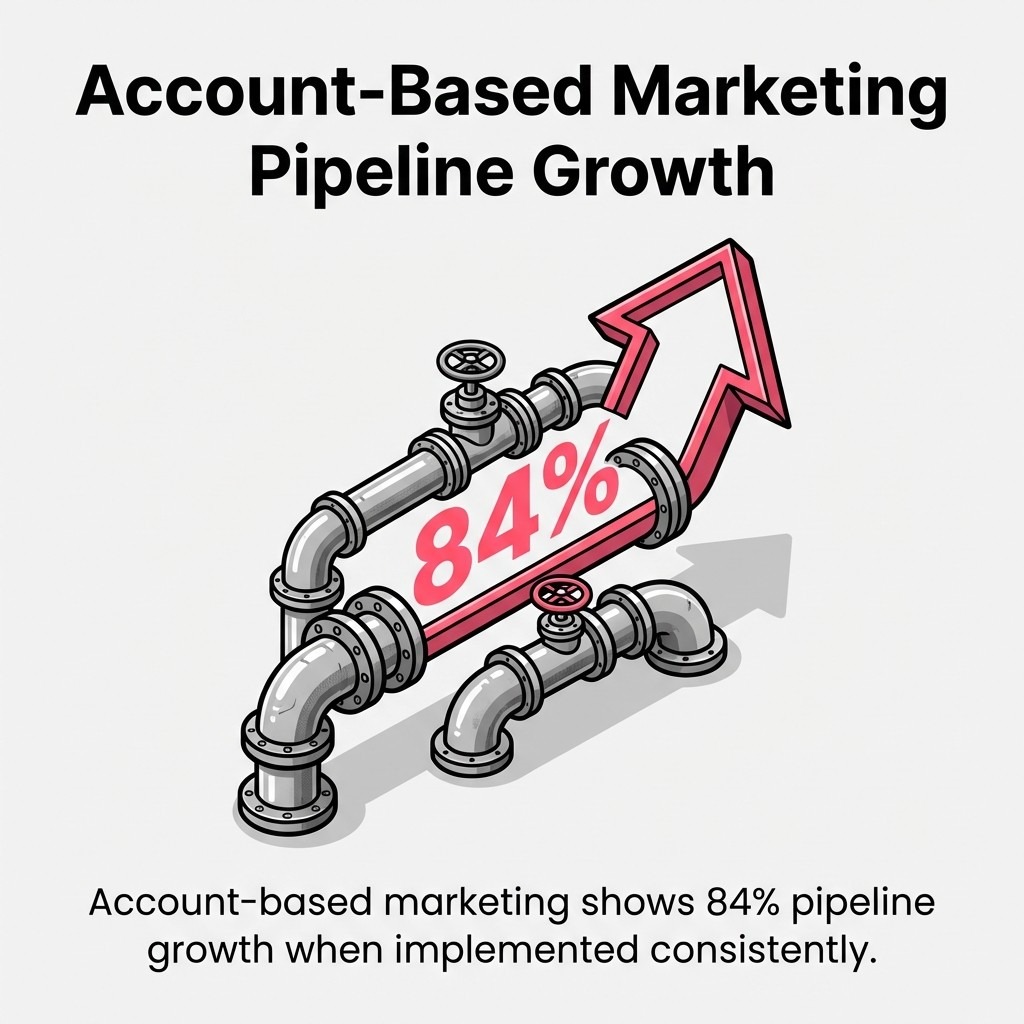
ABM programs frequently yield 84% pipeline growth when consistently executed—justify higher per-account investment.
ABM typically requires higher investment per account but delivers larger deal sizes. Calculate ABM ROI by comparing total program costs against revenue from targeted accounts specifically.
If you invested $120,000 in ABM targeting 50 accounts and closed 8 deals worth $1.8 million total, your ABM ROI is 1,400%.
Technical content marketing builds authority and generates organic traffic over time. White papers, case studies, technical guides, and how-to articles attract prospects throughout the buying cycle.
Content ROI requires patience. Initial content investments generate minimal returns, but compounding effects accelerate over 12-24 months as your content library grows.
Track content marketing performance through organic traffic from content pages, leads generated per content piece, content-influenced pipeline, and cost per lead from content versus other channels.
Trade shows remain important for manufacturers despite high costs per contact. The average lead generation cost at trade shows is around $112 per contact, but deal sizes and conversion rates can justify the investment.
Calculate trade show ROI carefully. Include booth costs, travel expenses, staff time, promotional materials, and opportunity costs. Track every lead generated and monitor their progression through your pipeline.
Many manufacturers discover that trade shows work best for relationship building with existing prospects rather than net-new lead generation. Measure both new opportunities created and existing pipeline advancement.
Return on ad spend (ROAS) measures the immediate revenue generated by paid advertising. It differs from overall marketing ROI by focusing specifically on paid media performance.
ROAS helps you optimize ad campaigns quickly because the metrics are directly connected. Spend more on ads, generate more immediate results. Unlike SEO or content marketing, paid advertising delivers fast feedback.
Calculate ROAS by dividing revenue generated by ads by the amount spent on those ads, then multiply by 100: (Revenue from Ads / Ad Spend) × 100.
If you spent $10,000 on Google Ads and attributed $35,000 in revenue to those ads, your ROAS is 350%.
Manufacturing ROAS benchmarks vary by industry segment. Industrial equipment manufacturers typically see 300-500% ROAS, while aftermarket parts distributors often achieve 400-700% ROAS due to lower customer acquisition costs and faster sales cycles.
The fastest way to improve return on ad spend is better audience targeting. Generic campaigns waste money on unqualified clicks.
Refine your targeting by excluding irrelevant job titles, using firmographic filters (company size, industry, revenue), creating custom audiences based on website behavior, and implementing remarketing for partial converters.
If you're in the automotive aftermarket, you want repair shops and fleet managers seeing your ads, not consumer car enthusiasts. Precise targeting reduces wasted spend and improves ROAS.
Your ROAS depends on both ad performance and post-click conversion rates. A campaign with 5% click-through rate but 1% conversion rate underperforms a campaign with 3% CTR but 4% conversion rate.
Optimize landing pages by matching headline to ad copy, removing navigation distractions, using clear calls-to-action, and including trust signals like certifications or customer logos.
Test landing page variations systematically. A 50% improvement in conversion rate doubles your ROAS without spending more on ads.
Marketing ROI extends beyond closed deals. Marketing also generates and influences pipeline that hasn't closed yet.
Pipeline influence metrics help you demonstrate marketing value before deals close. This is especially important for manufacturers where sales cycles span many months.
Marketing-sourced pipeline includes all opportunities where marketing generated the initial contact. These are deals that wouldn't exist without marketing activity.
Pull monthly reports showing total pipeline value where first touch was a marketing campaign. Track this over time to show marketing's contribution to future revenue.
If you have $4.5 million in marketing-sourced pipeline at a 25% close rate, marketing is on track to generate $1.125 million in eventual revenue.
Marketing-influenced pipeline includes all opportunities where marketing touched the prospect at any point in their journey, regardless of whether marketing generated the initial lead.
This metric is typically 2-4x larger than marketing-sourced pipeline because it includes deals that sales originated but marketing helped advance.
Track both metrics. Marketing-sourced shows demand generation effectiveness. Marketing-influenced demonstrates your role in supporting sales throughout the entire cycle.
Marketing can improve ROI by helping deals close faster, not just by generating more deals. Velocity metrics measure this impact.
Compare average days in pipeline for marketing-influenced opportunities versus non-influenced opportunities. If marketing-influenced deals close 20% faster, marketing is literally accelerating revenue.
Calculate velocity impact by comparing time from opportunity creation to close for engaged versus non-engaged prospects. Understanding your lead generation metrics helps identify which touchpoints accelerate deals most effectively.
The biggest obstacle to accurate ROI measurement isn't the formulas. It's getting clean, integrated data that connects marketing activities to revenue outcomes.
Most manufacturers struggle with disconnected systems that don't share information effectively. Your marketing automation platform knows which emails prospects opened, but your CRM doesn't see that data. Your sales team knows which deals closed, but can't tell you which marketing campaigns influenced them.
Start by connecting your core systems. Your marketing automation platform should sync bidirectionally with your CRM. Every lead, every campaign response, and every engagement should flow automatically into your CRM.
Add Google Analytics to track website behavior. Connect it to your CRM so you can see which campaigns drive website visits and which website behaviors predict conversions.
Implementation priorities include CRM and marketing automation integration, UTM parameter tracking across all digital campaigns, lead source fields that capture first and last touchpoints, custom fields for marketing influence flags, and dashboard reporting that combines data from multiple systems.
Trade shows, direct mail, sales calls, and other offline activities influence manufacturing deals but leave minimal digital footprints.
Close the loop by creating unique tracking codes for every offline campaign. Use campaign-specific landing pages for trade show follow-up. Assign unique phone numbers to different campaigns. Train sales teams to log all prospect touchpoints in your CRM.
Create a standardized intake process where sales logs campaign source for every new opportunity. Make this a required field in your CRM to ensure compliance.
ROI calculations are only as good as the data behind them. Duplicate records, incomplete contact information, and missing campaign attribution corrupt your measurements.
Implement data quality processes including regular deduplication, required fields for critical attributes, validation rules that enforce consistent formatting, and monthly audits of campaign attribution data.
Assign someone ownership of data quality. This isn't a one-time cleanup, it's an ongoing maintenance requirement.
Once you've established baseline ROI measurement, these advanced strategies help you optimize returns systematically.
Cohort analysis groups prospects by when they first engaged with marketing, then tracks their behavior over time. This reveals patterns that monthly reports miss.
Create cohorts based on first-touch month. Track each cohort's progression: percentage that became MQLs, percentage that became SQLs, percentage that became opportunities, and percentage that became customers.
If your January cohort converted to customers at 8% while your March cohort only converted at 4%, investigate what was different about your January campaigns.
Rarely does any single channel deliver optimal results. The highest ROI comes from coordinated multi-channel approaches where channels reinforce each other.
Test different budget allocations. If you currently spend 40% on paid search, 30% on content, 20% on email, and 10% on events, try shifting 10% from paid search to content and measure the impact.
Look for channel synergies. Content marketing that generates SEO traffic often works better when supported by paid promotion. Email nurturing performs better when combined with retargeting ads. For comprehensive strategies, explore our guide on marketing for manufacturing in the digital age.
True ROI measurement requires understanding what would have happened without marketing. Some customers would have found you anyway.
Test incrementality by running controlled experiments. Pause specific campaigns in specific regions while maintaining them elsewhere. Compare results to estimate true incremental impact.
If pausing your display advertising in the Southwest region reduced leads by only 5%, those ads probably weren't adding as much incremental value as your attribution suggested.
Consistent reporting keeps stakeholders informed and helps you spot trends before they become problems.
Create a monthly dashboard that tracks marketing investment by channel, leads generated by source, marketing-sourced pipeline value, marketing-influenced pipeline value, closed-won revenue with marketing attribution, customer acquisition cost by channel, and return on marketing investment overall and by major channel.
Keep it to one page if possible. Leadership doesn't need every metric, they need the ones that matter for decision-making.
Quarterly reviews provide time to analyze trends and recommend strategic adjustments. Focus on ROI trends over the past four quarters, channel performance comparison, CAC and LTV analysis, attribution model insights, and budget reallocation recommendations.
Tie marketing performance to business outcomes. Don't just report that you generated 230 leads. Report that those leads created $3.2 million in pipeline and $800,000 in closed revenue at a 12:1 ROI.
Use annual reviews to evaluate your overall marketing strategy. Compare actual ROI to projected ROI, identify which initiatives exceeded expectations, determine which underperformed and why, and build next year's budget based on channel ROI data.
This data-driven approach makes budget conversations easier. When you can demonstrate that SEO delivered 750% ROI while trade shows delivered 180% ROI, reallocation recommendations become obvious.
Manufacturing executives often come from engineering or operations backgrounds. They respect data, skeptically view marketing claims, and want concrete proof of value.
Your ROI reporting needs to speak their language.
Translate marketing metrics into business impact. Don't report "1,500 website visitors." Report "1,500 website visitors generated 87 qualified leads, creating $890,000 in pipeline."
Connect every marketing metric to a business outcome. Impressions don't matter unless they drive awareness. Awareness doesn't matter unless it generates consideration. Consideration doesn't matter unless it creates sales.
Build your narrative from business outcomes backward to marketing activities. "We closed $2.4M in new business this quarter. 68% of those deals engaged with marketing. Here's how each channel contributed."
Context matters. A 300% marketing ROI might sound great until you learn that industry benchmarks are 500%.
Compare your performance to relevant benchmarks. Manufacturing marketing typically delivers 400-600% ROI according to various industry studies. Email marketing in B2B achieves $36-$45 return per dollar invested. SEO compounds to 748% ROI over multi-year periods.
When you're beating benchmarks, highlight it. When you're trailing, explain what you're doing to close the gap.
Historical ROI proves past value. Forecasting future performance helps leadership plan.
Use your historical data to project future returns. If your average customer takes 130 days to close and you currently have $5 million in marketing-influenced pipeline at a 28% historical close rate, forecast $1.4 million in revenue over the next 4-5 months.
Update forecasts monthly as pipeline evolves. This demonstrates marketing's ongoing contribution to future revenue, not just past results. Our 3x revenue growth case study shows how systematic measurement and optimization drives predictable results.
Even experienced marketers make these errors. Recognizing them helps you build more accurate measurement systems.
The single biggest mistake is using last-touch attribution for complex B2B sales. Last-touch gives your whitepaper zero credit even though it started the relationship four months ago.
Manufacturing sales involve multiple touchpoints over extended periods. Your attribution model must reflect this reality or you'll systematically undervalue top-of-funnel activities.
Don't compare channel ROI without considering their different roles. SEO builds long-term organic visibility while paid search delivers immediate results. Email nurtures existing relationships while content marketing attracts new prospects.
Each channel serves different purposes. Measure them against their intended outcomes, not against each other.
Content marketing and SEO require 6-12 months before showing significant returns. Evaluating them monthly creates false negatives and leads to premature campaign cancellation.
Match your measurement timeframe to channel maturity cycles. Paid search can be evaluated monthly. SEO needs quarterly assessment minimum. Content marketing shows its full value over annual periods.
First-purchase ROI tells an incomplete story for manufacturers with ongoing parts and service revenue. A customer might generate $40,000 in initial equipment revenue but $120,000 in parts and service over eight years.
Calculate customer acquisition cost against lifetime value, not just initial purchase value. This often justifies higher CAC for customers with strong recurring revenue potential. Review our guide on managing advertising budgets effectively to balance acquisition costs with long-term value.
Measurement without action wastes time. The point isn't generating reports, it's making better decisions.
You've now got the framework to measure B2B marketing ROI accurately for your manufacturing business. You understand attribution models that reflect your long sales cycles. You can calculate customer acquisition cost and lifetime value. You know which channels typically deliver the strongest returns for industrial companies.
Start with first-touch attribution to understand demand generation. Add your measurement period to match your sales cycle length. Calculate your total marketing investment including all those hidden costs most manufacturers miss.
Build your monthly dashboard focused on the metrics that matter: marketing-sourced pipeline, marketing-influenced revenue, customer acquisition cost by channel, and overall marketing ROI with clear attribution methodology noted.
Connect your systems so data flows automatically from marketing automation to CRM. Implement UTM tracking on every digital campaign. Train your sales team to log campaign attribution for every opportunity.
Then use what you learn. Shift budget from channels delivering 200% ROI toward channels generating 600% ROI. Double down on content that attracts your best prospects. Cut campaigns that consume budget without moving prospects through your pipeline.
The manufacturers who win aren't the ones with the biggest marketing budgets. They're the ones who measure what works and do more of it.