
Product listing ads optimization isn't about perfecting every attribute at once. It's about fixing the three things killing your click-through rate right now: vague product titles, miscategorized feeds, and images that blend into the grid.
Retailers with optimized product feeds achieve 40 to 60% higher conversion rates than those running bare-minimum setups.
The gap isn't talent or budget. It's deliberate feed strategy.

Most ecommerce brands treat Google Merchant Center like a required chore. Upload the feed, set a budget, hope for sales. That's backwards.
Your competitors are fighting for visibility among 1.2 billion monthly Google Shopping searches. The stores winning that fight obsess over product data quality. They test title variations. They map categories correctly the first time. They treat feed optimization like the conversion lever it actually is.

I've spent years managing Google Shopping campaigns for ecommerce brands, and the pattern is obvious: stores that master product feed mechanics outperform their ad spend by 3x. Not because they bid higher. Because their PLAs show up for the right searches, communicate value instantly, and earn the click before shoppers compare alternatives.
You're about to learn the exact optimization strategies that separate top performers from the rest. We'll cover feed architecture, title formulas, image standards, campaign structure, and the custom label tactics that let you bid smarter. By the end, you'll know how to build product listing ads that actually compete.
Product listing ads are the visual shopping results that appear when someone searches Google with purchase intent. They show your product image, price, title, and store name before the shopper clicks anything.
PLAs pull every detail from your Google Merchant Center product feed. That feed is a structured data file mapping each product's attributes: title, description, price, availability, category, image URL, GTIN, brand, and more. Google uses this data to match your products to search queries and display them in Shopping results.
The quality of your feed determines everything about PLA performance. A poorly structured feed means your products show for irrelevant searches, get buried beneath competitors, or don't appear at all. An optimized feed means your ads surface for high-intent searches, communicate value immediately, and convert browsers into buyers.
Most stores upload the bare minimum. Product name, price, image. Maybe a category if the platform forces it. That approach loses to competitors who understand feed optimization as the foundation of Google Shopping success.
Every attribute you include gives Google more context to match your products accurately. Better matches mean higher click-through rates. Higher CTR signals to Google that your ads are relevant. Relevance lowers your cost-per-click and improves ad position. The cycle compounds.
Amazon maintains 59% visibility share in ecommerce search results. Google Shopping is where you compete without needing an Amazon storefront. But only if your feed quality matches or exceeds what shoppers expect from marketplace listings.
Product listing ads require specific data fields to even appear in Google Shopping results. Skip these and your products won't display, regardless of budget.
Those five attributes are mandatory. Your ads literally won't run without them. But mandatory doesn't mean competitive.
Competitive PLAs include optional attributes that improve matching and performance: brand, GTIN (barcode number), MPN (manufacturer part number), product category, color, size, material, pattern, age group, gender, and custom labels. Each addition sharpens Google's ability to show your products to the right shoppers.
I see the same feed mistakes across hundreds of ecommerce accounts. Titles stuffed with keywords that don't match search intent. Images cropped inconsistently. Prices that don't sync with the website. Categories chosen randomly from dropdown menus.
These errors don't just lower performance. They trigger Merchant Center disapprovals that prevent your products from showing at all. Google enforces strict policies. Violate them and your entire feed gets suspended until you fix every flagged item.
The most common disapproval reasons: mismatched landing page prices, low-quality images, prohibited content in titles, incorrect availability status, and missing required attributes. Each disapproval delays your campaigns by days or weeks while you debug and resubmit.
Feed quality isn't optional. It's the barrier to entry. Once you clear that bar, optimization becomes your competitive advantage.
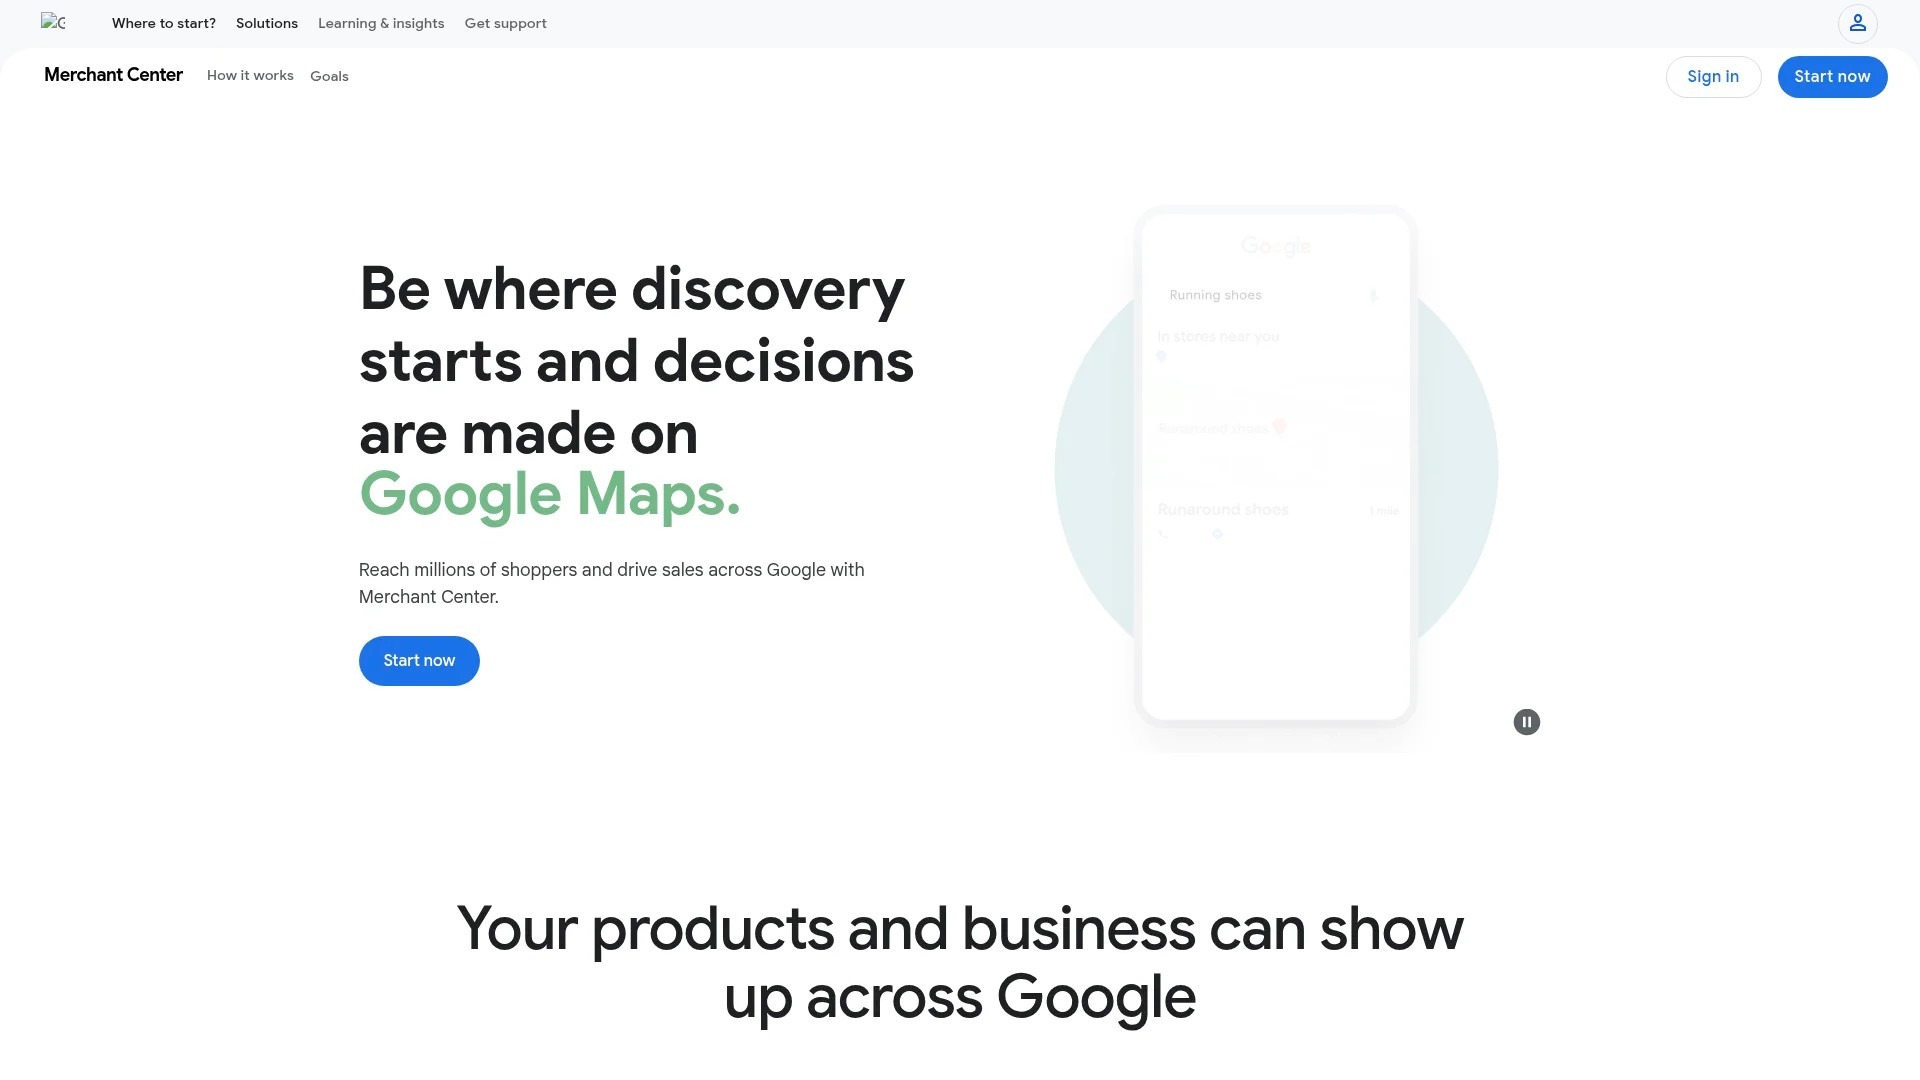
Google Merchant Center is the platform where you upload and manage your product feed. It connects to your Google Ads account to serve PLAs in Shopping campaigns.
Setting it up correctly the first time prevents months of troubleshooting later. Most errors happen during initial configuration, when stores rush through verification steps or misconfigure shipping settings.
Start by creating your Merchant Center account at merchants.google.com. You'll verify your website domain, configure tax and shipping rules, and link to your Google Ads account.
Google requires proof that you own the website you're advertising. You'll add an HTML verification tag to your site's header or upload a verification file to your server. This confirms you have control over the domain and prevents unauthorized sellers from advertising your products.
Complete your business information accurately. Store name, customer service contact, return policy URL, and physical address. These details appear in your Shopping listings and build trust with shoppers comparing options.
Accuracy matters. If your return policy link breaks or customer service number disconnects, Google can suspend your account for policy violations.
Merchant Center requires shipping and tax settings before your feed goes live. Configure these at the account level or include them in individual product attributes.
For shipping, define your rates by weight, price, or destination. If you offer free shipping above certain order values, set those thresholds. 51% of cart abandonments stem from delivery expectations not met. Transparent shipping costs in your PLAs reduce surprise abandonment at checkout.
Tax configuration depends on your business location and where you ship. U.S. sellers need to configure sales tax by state. International sellers must comply with local VAT requirements. Get this wrong and your displayed prices won't match checkout totals, triggering disapprovals.
You have three options for getting product data into Merchant Center: manual upload, scheduled fetch, or API integration.
Manual upload works for small catalogs under 100 products. You create a spreadsheet with required attributes and upload it directly. This approach doesn't scale and requires manual updates whenever prices or inventory change.
Scheduled fetch is better. You host a product feed file on your server (XML, CSV, or TSV format). Merchant Center automatically fetches updates on your chosen schedule: hourly, daily, or weekly. This keeps data synchronized without manual intervention.
API integration is the most reliable option for dynamic catalogs. Your ecommerce platform or feed management tool pushes product updates to Merchant Center in real-time. Price changes, stock status, and new products sync immediately.
Most Shopify, WooCommerce, and BigCommerce stores use apps that automate feed creation and syncing. Google Shopping integrations exist for every major platform. The setup takes an hour but saves hundreds of hours maintaining manual feeds.
Your product feed is a database. Each row represents one product. Each column represents an attribute Google uses for matching, bidding, and display.
Optimization means filling those columns with data that improves relevance, click-through rate, and conversion rate. The more context you provide, the better Google can serve your products to shoppers ready to buy.
Product feed management isn't a one-time task. It's ongoing refinement based on performance data.
Complete feeds outperform incomplete feeds in every metric. Google's algorithm prioritizes products with rich attribute data because they match search intent more precisely.
Start with required attributes, then add every optional field that applies to your products. If you sell clothing, include color, size, gender, age group, and material. If you sell electronics, include brand, MPN, GTIN, and specific technical specs in the description.
Accuracy is non-negotiable. Your feed price must match the landing page price exactly. Availability status must reflect real-time stock levels. Shipping times must align with actual fulfillment capacity. Discrepancies trigger disapprovals and erode shopper trust.
Audit your feed monthly. Check for outdated prices, broken image links, and discontinued products still marked as available. Automated feed tools catch most errors, but manual review finds edge cases that slip through.
Google Product Category is a standardized taxonomy with over 6,000 categories. You assign each product to the most specific category that describes it.
Correct categorization determines which search queries trigger your PLAs. Miscategorized products appear for irrelevant searches, waste ad spend, and miss high-intent buyers searching the right category.
Incorrect categorization results in cost-per-click averaging $2.10, while correct categorization reduces it to $1.35. That's a 36% cost reduction from fixing one attribute.
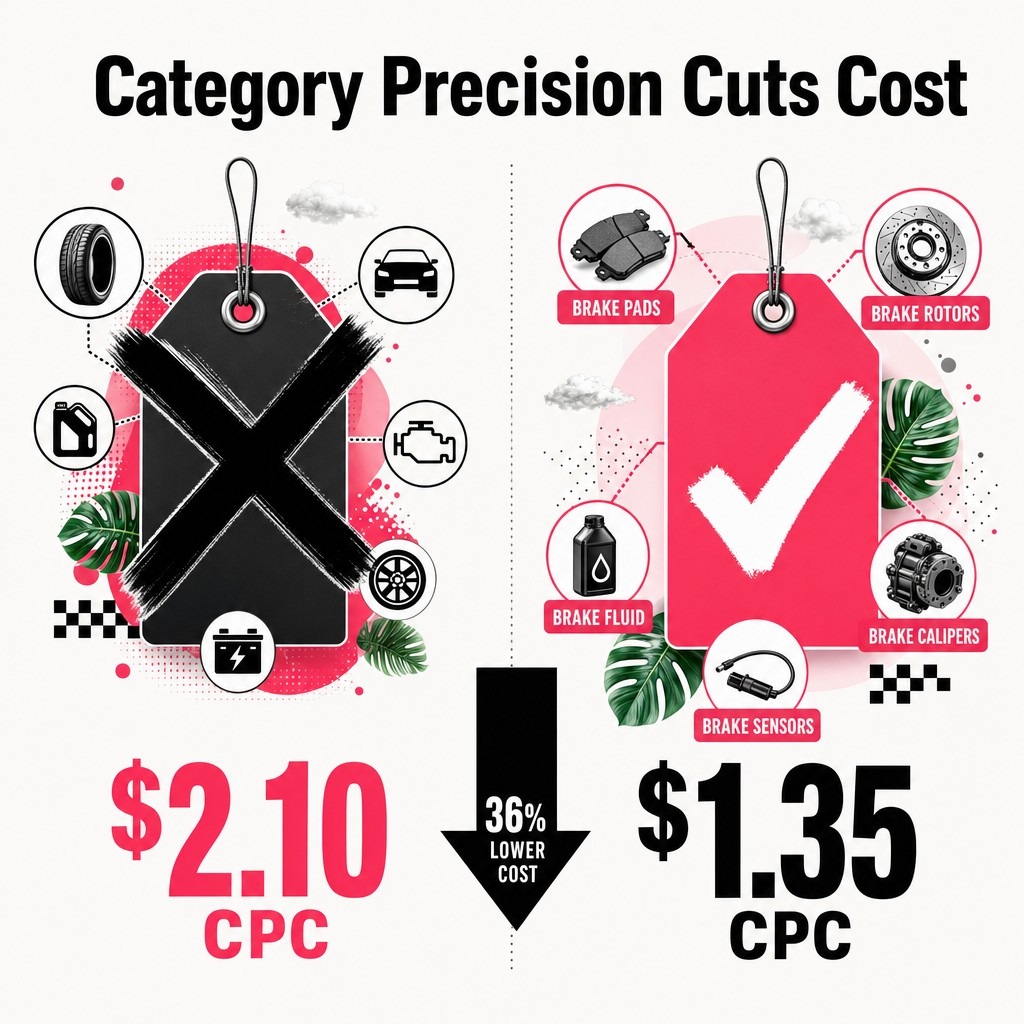
Use Google's product category taxonomy to find the exact match. Drill down from broad to specific. A men's running shoe belongs in "Apparel & Accessories > Shoes > Athletic Shoes," not just "Shoes."
Your ecommerce platform's internal categories don't matter. Google requires its standardized taxonomy because it ensures consistent matching across millions of products from thousands of sellers.
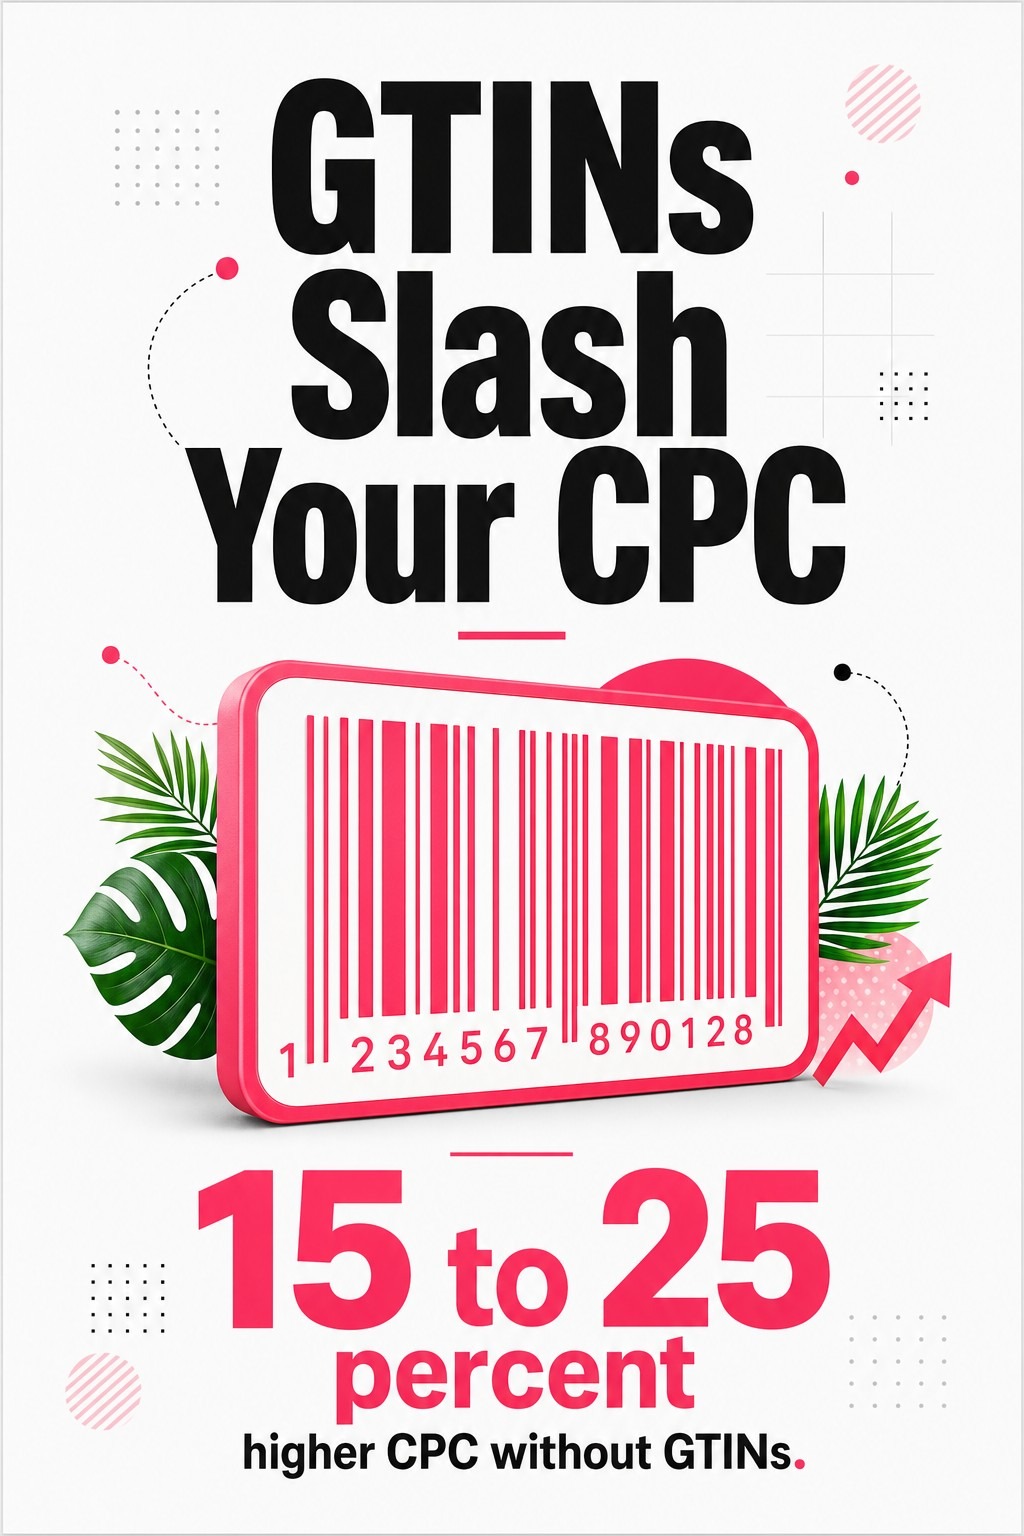
GTINs (Global Trade Item Numbers) are unique product identifiers like UPCs and EANs. They're the barcode numbers on product packaging.
Google requires GTINs for all new, branded products with assigned codes. Including them improves your product's eligibility for rich result features and enhances matching accuracy.
Listings without GTINs can reduce overall feed performance by 15 to 25% in cost-per-click metrics. The algorithm treats products with identifiers as more trustworthy and shows them more frequently.
If you manufacture your own products or sell unbranded goods, GTINs don't apply. Use the Manufacturer Part Number (MPN) instead, or mark the product as not requiring an identifier in your feed.
Never invent fake GTINs. Google verifies codes against global databases. Fake identifiers trigger account suspension.
Product titles are the most important text element in your PLAs. They appear prominently in search results and determine whether shoppers click your ad or a competitor's.
Google allows 150 characters for titles, but mobile devices truncate after 70. Your most important information needs to appear in the first 70 characters.
Effective titles follow a formula: Brand + Product Type + Key Attributes + Modifiers. Each component serves a purpose.
Start with brand name. Shoppers searching for specific brands filter by name first. "Nike" or "Sony" at the beginning captures brand-loyal buyers immediately.
Follow with product type. This is the category-level descriptor: "Running Shoes," "Wireless Headphones," "Brake Pads." It matches broad search intent and establishes what you're selling.
Add key attributes that differentiate your product from alternatives. For apparel: color, size, material, style. For electronics: model number, capacity, connectivity type. For automotive parts: year/make/model compatibility, OEM vs. aftermarket.
Titles should incorporate high-intent long-tail keywords that reflect specific customer requirements. A shopper searching "brake pads for 2018 Honda Civic" needs compatibility confirmation in your title, not generic "quality brake pads."
End with modifiers that add urgency or value: "Free Shipping," "Sale," "New 2025 Model." These elements improve CTR when shoppers compare multiple similar products.
Weak title: "Brake Pads - High Quality - Free Shipping"
Strong title: "EBC Brakes Front Brake Pads for 2016-2022 Honda Civic - Ceramic - OEM Replacement"
The strong version includes brand (EBC Brakes), position (Front), product type (Brake Pads), compatibility (2016-2022 Honda Civic), material (Ceramic), and quality signal (OEM Replacement). It answers every question a shopper needs before clicking.
Weak title: "Women's Running Shoes - Comfortable - Many Colors"
Strong title: "Nike Air Zoom Pegasus 40 Women's Running Shoes - Black/White - Size 8.5 - Lightweight Cushioning"
The strong version specifies brand, model, gender, product type, color, size, and key benefit. A shopper knows exactly what they're clicking on.
Keyword stuffing makes titles unreadable. "Brake Pads Best Brake Pads Cheap Brake Pads for Honda Civic Accord CR-V" triggers spam filters and confuses shoppers. Write for humans first, search algorithms second.
ALL CAPS titles violate Google's policies and look unprofessional. Use standard capitalization.
Promotional text in titles ("SALE!!!", "LIMITED TIME!!!") triggers disapprovals. Save promotional language for custom labels and descriptions.
Vague descriptors waste character count. "High Quality" and "Best Value" mean nothing. Specific attributes like "OEM-Grade" or "20% Lighter Than Stock" communicate actual value.
Test title variations using Google Shopping campaign optimization strategies. Split products into test groups, run different title formats, and measure CTR differences after two weeks.
Your product image is the first thing shoppers see. It appears larger than your title in most Shopping result layouts. Poor images kill CTR before shoppers read anything.
Listings with better photo quality are 4.5% more likely to sell. That edge compounds across thousands of impressions.

Google sets minimum technical standards: 800x800 pixels, but recommends 2000x2000 for zoom functionality. Images must be clear, well-lit, and accurately represent the product.
Use square aspect ratios. 1:1 ratio (2000x2000 pixels) works best. Rectangular images get cropped unpredictably across different devices.
White or transparent backgrounds are standard for most categories. They make products stand out in grid layouts and look professional. Busy backgrounds distract from the product and reduce perceived quality.
File formats: JPEG, PNG, or WebP. Keep file sizes under 16MB. Larger files slow load times and increase bounce rates.
Show the product clearly. No watermarks, promotional text, or borders. Google disapproves images with overlaid text, logos, or graphics that obscure the product.
White background images work best for products where details matter: electronics, tools, automotive parts, appliances. Shoppers need to see specifications clearly.
Lifestyle images work better for apparel, home decor, and products where context helps shoppers visualize use. A couch photographed in a living room converts better than the same couch on white background.
Test both approaches in your category. Run split campaigns with different image styles and compare conversion rates. A/B testing requires at least 500 monthly visitors to reach statistical significance. Wait for adequate sample size before drawing conclusions.
80% of consumers switch between online search and video when researching products. Adding product videos to your listings captures this behavior. Google supports video in Shopping ads through merchant-hosted product videos.
Your main image shows up in search results. Additional images appear on your product page and in expanded Shopping ad formats.
Include multiple angles: front, back, side, top. For products with important details, add close-up shots showing texture, materials, or specific features.
For automotive parts, show packaging, part numbers, and installation angles. For apparel, show the garment on a model and as a flat lay. For electronics, show ports, controls, and screen details.
Consistency across your catalog builds brand recognition. Use the same background, lighting, and angles for all products in a category. Professional studios that specialize in ecommerce product photography deliver this consistency at scale.
How you structure your Google Shopping campaigns determines your bidding precision. Lumping all products into one campaign with one bid means you overpay for low-value clicks and underbid on high-intent searches.
Smart campaign structure segments products by performance characteristics. You bid aggressively on high-converting products and conservatively on exploratory inventory.
The goal is granular control without creating unmanageable complexity.
Product groups are subdivisions within Shopping campaigns. You create groups based on feed attributes: category, brand, product type, custom labels, item ID.
Start broad, then split high-volume groups into finer segments. A campaign for all "Shoes" becomes less effective than separate campaigns for "Running Shoes," "Casual Shoes," and "Dress Shoes," each with different bids.
Campaign priority settings (Low, Medium, High) control which campaign serves ads when products exist in multiple campaigns. High-priority campaigns serve first. Use this for testing: run a high-priority campaign with new bid strategies while maintaining a low-priority baseline campaign for the same products.
Custom labels are feed attributes you define yourself. Google provides five custom label fields (custom_label_0 through custom_label_4). Use them to tag products by margin, seasonality, bestseller status, or any other business metric.
Example custom label strategy:
Segment campaigns by custom labels to bid differently on high-margin bestsellers vs. low-margin clearance items. Push overstock harder during slow periods. Reduce spend on low-margin products that eat budget without profit contribution.
Update custom labels monthly based on performance shifts. Bestsellers change. Margins fluctuate with supplier costs. Seasonal products rotate in and out of peak windows.
Check out detailed feed attribute strategies for implementation guidance.
Your top 20% of products drive 80% of revenue. They deserve dedicated campaigns with custom bids.
Create single-product campaigns for bestsellers. This gives you complete bid control, dedicated budgets, and clearer performance data. You're not averaging performance across dozens of products.
Monitor these campaigns daily. Adjust bids based on impression share, CTR, and conversion rate. Top products justify the management overhead.
Performance Max is Google's automated campaign type that serves ads across Search, Shopping, Display, YouTube, and Gmail using one campaign.
It replaced Smart Shopping campaigns in 2022. Google pushes it aggressively as the default for ecommerce advertisers.
Performance Max works well when you trust Google's algorithm and have sufficient conversion data for machine learning. It struggles when you need manual bid control or category-specific strategies.
Strengths: Reaches shoppers across multiple Google properties. Automated bidding optimizes for conversions. Minimal setup and management time required. Performs well for stores with broad catalogs and consistent conversion rates.
Limitations: No search query visibility. Limited control over where ads appear. Requires conversion tracking and sufficient data volume (at least 30 conversions in 30 days for optimal learning). Difficult to optimize specific product segments or exclude poorly performing categories.
Average Google Ads conversion rate in 2025 reaches 7.52%. Performance Max campaigns that exceed this benchmark typically have clean product feeds, strong creative assets, and conversion tracking configured correctly.
I recommend starting with Standard Shopping campaigns for control and learning. Switch to Performance Max after you understand which products convert and at what margin. Let automation scale what already works.
Performance Max requires asset groups: collections of headlines, descriptions, images, logos, and videos that Google mixes across placements.
Provide 15 headlines and 4 descriptions minimum. Google tests combinations to find top performers. Write headlines focused on benefits, features, and differentiation. Avoid generic marketing speak.
Include your best product images and brand logo. Add videos if available. More assets give Google more creative combinations to test.
Product feed quality still determines Performance Max success. The automation layer can't fix poor titles, wrong categories, or missing attributes.
Audience signals tell Performance Max who to target initially. You add customer lists, website visitors, and interest-based audiences. The algorithm uses these as starting points, then expands based on performance.
Set conversion goals carefully. If you optimize for purchases, the algorithm prioritizes transactions. If you optimize for leads, it prioritizes form submissions. Misaligned goals produce irrelevant traffic.
Monitor Performance Max using the Insights tab. Check which categories drive conversions, which audience segments perform best, and which placements deliver results. Use this data to refine asset groups and adjust budgets.
For detailed setup guidance, review Google Shopping campaign blueprints that walk through current best practices.
Getting clicks is half the job. Converting clicks into purchases is the other half.
Your PLA optimization doesn't end at Google. It extends through your product pages, checkout flow, and post-purchase experience.
High-converting product descriptions boost conversions by up to 78%. That improvement happens on your site, not in Google's system.
Your PLA promises specific features, prices, and availability. Your landing page must deliver exactly what the ad promised.
Price discrepancies kill trust instantly. If your PLA shows $49.99 but the product page shows $59.99, shoppers bounce. Google also disapproves listings with mismatched prices.
Ensure product titles, images, and descriptions on your landing page match your feed data. Consistency builds confidence. Inconsistency signals poor quality or bait-and-switch tactics.
Page load speed affects conversion directly. 53% of users abandon sites that take longer than three seconds to load. Optimize images, enable caching, and use content delivery networks to hit sub-2-second load times.
Shoppers clicking PLAs have specific questions. Your product description answers them before they ask.
For automotive parts: compatibility (year/make/model), installation difficulty, OEM vs. aftermarket quality, warranty coverage.
For electronics: technical specifications, compatibility with other devices, what's included in the box, warranty and support.
For apparel: fit guidance, material composition, care instructions, sizing charts.
Use bullet points for scannability. Lead with benefits, follow with features, end with specifications. Shoppers skim first, read details second.
Include social proof. Products with at least five reviews are 270% more likely to be purchased. Display reviews prominently near the add-to-cart button.
Mobile devices account for 63.13% of Google Shopping traffic. Your mobile product pages must convert as well as desktop.
Test your mobile checkout flow monthly. Remove unnecessary form fields. Enable autofill for addresses and payment. Offer guest checkout to reduce friction.
Shipping transparency matters. Show shipping costs early. Offer free shipping thresholds. Display delivery estimates before checkout begins.
Cart abandonment emails recover 10-15% of lost sales. Set up automated sequences that remind shoppers about abandoned items and offer limited-time discounts to complete purchase.
Your competitors are optimizing their PLAs too. Staying ahead means monitoring their strategies and adapting faster.
72% of consumers have opted for a new brand's product over their established preferred brands. Loyalty is weak. Whoever presents the better offer in the moment wins the sale.
Competitive analysis reveals gaps in your strategy and opportunities to differentiate.
Use Google Shopping search to manually review competitor ads. Search your primary keywords and note which competitors appear, what their titles emphasize, how their images compare, and what prices they display.
Screenshot top competitor ads monthly. Track changes in their messaging, promotions, and product range. Shifts signal strategic changes worth investigating.
Third-party tools like SEMrush, SpyFu, and AdBeat track competitor ad spend, impression share, and ad copy variations. They show which products competitors push hardest and where they're gaining market share.

For automotive aftermarket specifically, competitors often differentiate on compatibility guarantees, shipping speed, and OEM vs. performance part positioning. Monitor how they communicate these differentiators.
Learn proven competitor analysis techniques that uncover strategic advantages.
Amazon's Featured Offer prices commonly position at or below the lowest-priced alternatives. Competitive pricing matters across all channels, including Google Shopping.
Dynamic pricing tools adjust your prices based on competitor movements, inventory levels, and demand patterns. Prisync and Competera automate competitive price monitoring and suggest optimal price points.


Price isn't everything. Shoppers pay more for faster shipping, better return policies, and trusted brands. Compete on total value, not just lowest price.
Highlight shipping speed and return guarantees in your promotions. Use Google Merchant Center promotions to display these differentiators directly in your PLAs.
If you sell products identical to dozens of competitors, differentiation comes from brand positioning and customer experience.
Build trust through content. Publish installation guides, compatibility charts, and product comparison tools. Shoppers researching complex purchases remember brands that helped them make informed decisions.
Invest in customer service. Fast responses, easy returns, and helpful support create word-of-mouth referrals and repeat purchases.
Organizations experience higher revenue growth rates with higher product quality. Quality extends beyond the product itself to every touchpoint: how you describe products, respond to questions, handle problems, and deliver orders.
Managing product feeds manually doesn't scale past 500 SKUs. Automation and AI-powered tools handle the complexity so you focus on strategy.
Feed management platforms like DataFeedWatch, Feedonomics, and Channable automate optimization tasks that would take hours manually.


AI tools analyze top-performing products in your category and suggest title improvements. They identify which attributes correlate with higher CTR and automatically format titles to include those elements.
For example, if products with color mentioned in the first 40 characters consistently outperform those without, the tool restructures all your titles to prioritize color placement.
Description optimization works similarly. AI identifies high-converting keywords and ensures they appear prominently in product descriptions without keyword stuffing.
Your internal product categories don't match Google's taxonomy perfectly. Feed management platforms automatically map your categories to Google's standardized structure using machine learning.
They also enrich missing attributes by analyzing product titles and descriptions. If your feed lacks "color" attributes but your titles mention colors, the tool extracts and populates the color field automatically.
This enrichment improves match rates and reduces disapprovals from missing data.
If you sell on multiple platforms (Amazon, eBay, Facebook Marketplace), maintaining separate feeds for each becomes impossible manually.
Feed management tools centralize your product data and output channel-specific feeds automatically. Amazon requires different attributes than Google. Facebook has different image requirements. The tool handles these variations without manual intervention.
Centralized feed management also ensures price and availability consistency across channels. When you update stock in your ecommerce platform, all marketplace feeds sync automatically.
Optimization is continuous. You test, measure, adjust, and test again.
Track metrics that directly impact profitability: conversion rate, cost per conversion, return on ad spend, and impression share.
Ignore vanity metrics like total impressions or clicks without context. Clicks from irrelevant searches waste money. Impressions that don't convert signal poor targeting.
Conversion rate measures how many clicks turn into purchases. Industry average is 7.52%, but top performers hit 10-15% through feed optimization and landing page improvements.
Click-through rate indicates ad relevance. Low CTR means your titles, images, or pricing aren't competitive. High CTR with low conversion rate suggests your landing page doesn't match ad promises.
Cost per conversion shows profitability. Track this against product margins. If your cost per conversion exceeds margin, you're losing money on every sale.
Return on ad spend (ROAS) is revenue divided by ad spend. Aim for 4:1 minimum (four dollars revenue for every dollar spent). Top performers achieve 6:1 or higher through precise targeting and high-margin product focus.
Impression share reveals how often your ads appear for relevant searches. Low impression share means you're missing opportunities due to budget constraints or low ad rank.
Week one: Audit feed quality. Check for disapprovals, broken links, outdated prices, and missing attributes. Fix errors immediately.
Week two: Analyze top and bottom performers. Identify which products drive profit and which drain budget. Adjust bids accordingly. Pause products with negative ROI.
Week three: Test new strategies. Split-test title variations, try different image styles, experiment with custom label segmentation. Run tests for minimum two weeks before drawing conclusions.
Week four: Review competitor movements. Check pricing changes, new product launches, and promotional strategies. Adjust your approach to maintain competitive positioning.
This cycle ensures continuous improvement without reactive chaos. AI Overviews cause a 58% reduction in paid search click-through rates. Adapting to algorithm changes requires consistent monitoring and rapid iteration.
Link Google Analytics to your Google Ads account to track post-click behavior. See which products shoppers view after clicking PLAs, how long they stay on site, and where they drop off in checkout.
Merchant Center diagnostics report shows feed errors, disapproved products, and performance warnings. Review this weekly. Google flags issues before they trigger account suspensions.
The Products tab in Merchant Center shows click and impression data by product. Sort by clicks to find top performers. Sort by impressions with low clicks to identify poor-performing titles or images needing optimization.
Export reports monthly and track trends over time. Seasonal products show predictable patterns. New product performance indicates whether launch strategies worked. Price changes correlate with conversion rate shifts.
Use this data to inform next month's strategy. Double down on what works. Cut what doesn't. Test hypotheses about why certain products underperform.
You now have the complete framework for product listing ads optimization. Feed quality, title formulas, image standards, campaign structure, and conversion optimization.
Implementation is what separates knowledge from results.
Start with your feed. Audit it today for missing attributes, incorrect categories, and outdated data. Fix the errors Google flagged in your Merchant Center diagnostics. Every disapproved product is lost revenue.
Then optimize your top 20 products. Rewrite titles using the formula from section four. Replace poor images with professional shots. Create single-product campaigns with aggressive bids.
Monitor performance weekly. Track conversion rate, ROAS, and impression share. Identify patterns. Products converting well deserve more budget. Products wasting spend need better targeting or should be paused.
Test one new strategy monthly. Try custom labels for margin-based bidding. Experiment with Performance Max for your bestsellers. A/B test title variations on high-volume products.
The stores dominating Google Shopping didn't optimize everything at once. They built systems that compound: better feeds attract more qualified clicks, higher conversion rates improve Quality Score, lower costs per click enable more aggressive bidding, increased visibility drives more sales.
That flywheel starts with the work you do this week.