

Performance Max statistics in 2026 describe a campaign type that more than one million advertisers use, according to AdExchanger, with results that depend heavily on who measured them. Google says advertisers who make the most of PMax see an average 18% increase in incremental conversions at a similar cost per action. Optmyzr's Q1 2026 benchmarks show PMax ROAS down 4.53% year over year.
The flattering numbers and the sobering ones rarely sit on the same page. I've been running search campaigns since I started SCUBE in 2009, and that gap still trips up smart teams at budget time. Every figure below carries its source and date, so you can see which ones belong in a budget deck.
The table below gathers every key PMax figure in this roundup and tags each one by publisher and type. Use the label column before you paste anything into a report.
Vendor claims come from Google's internal data. Tinuiti and Optmyzr benchmarks reflect their own client bases, not the whole market.
Performance Max is Google's goal-based, AI-driven campaign type that serves ads across Search, Shopping, YouTube, Display, Gmail, Discover and Maps from a single campaign. You supply creative assets, audience signals, conversion goals and, for ecommerce, a Merchant Center product feed. Automated bidding and asset combinations handle the rest.
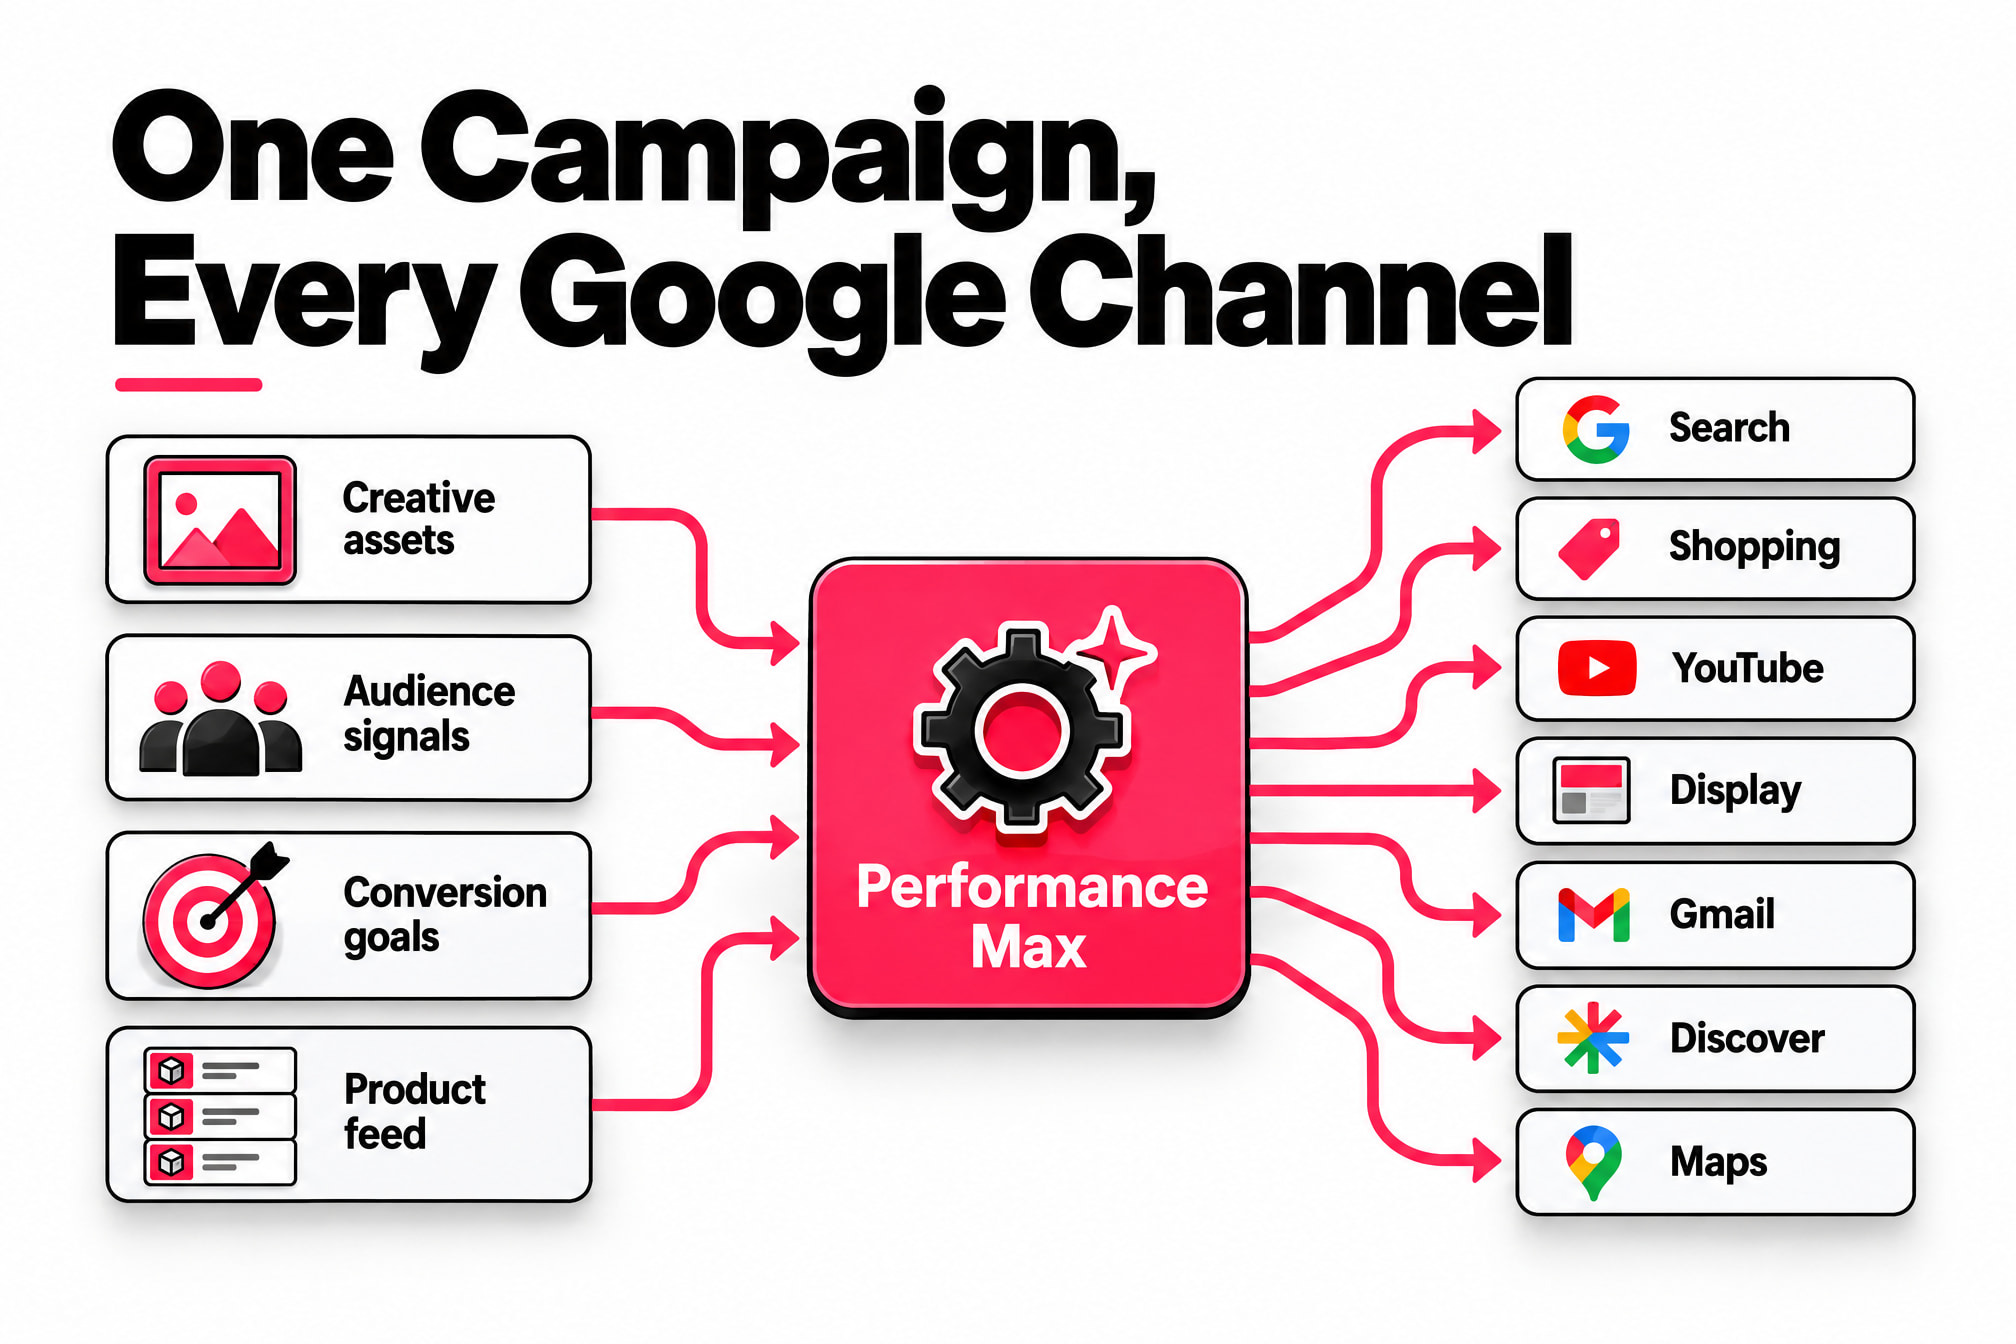
Because one campaign feeds every channel, a weak product feed hurts results everywhere at once rather than in a single placement.
For a large catalog, that's like handing your entire parts counter to a salesperson who works every aisle at once and sends you a summary instead of a call log. The salesperson is fast. But they only know what your product data tells them. That's why getting started with Google Performance Max is mostly a feed structure job, not a settings job.
Performance Max adoption is broad, yet retailers who run it next to standard Shopping keep moving budget between the two. AdExchanger reported in April 2025 that more than one million advertisers use PMax. Google hasn't confirmed that count on its own pages.
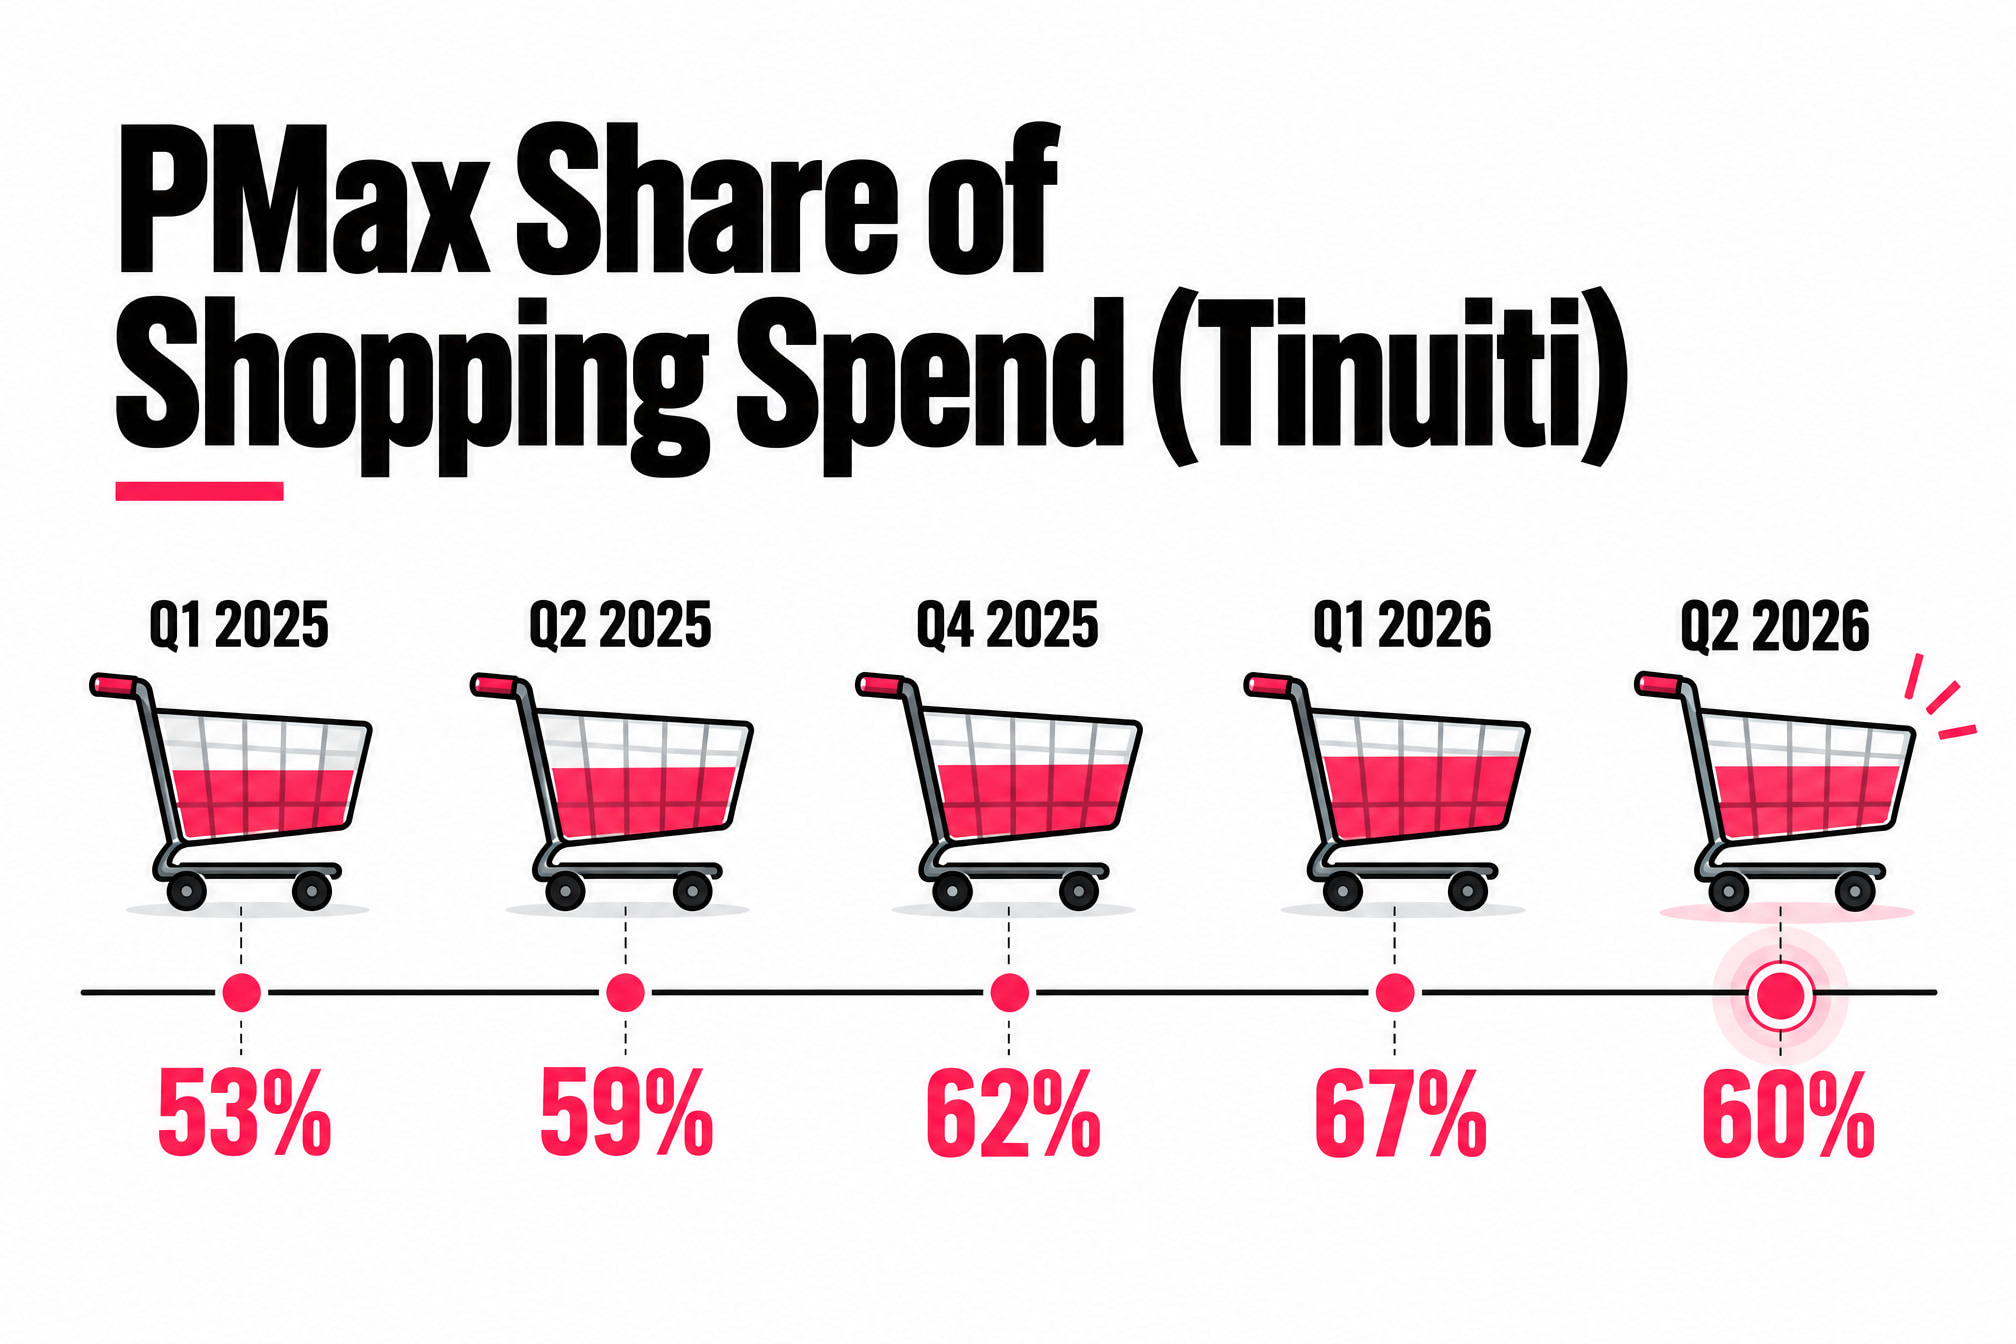
Figures cover only Tinuiti clients running both PMax and standard Shopping, so they track budget habits rather than the whole market.
The Shopping split is more revealing. Among Tinuiti clients running both campaign types, PMax took 53% of Shopping spend in Q1 2025 and 59% in Q2 2025. Tinuiti puts Q4 2025 at 62%, down from 69% a year earlier. A summary of Tinuiti's Q2 2026 report shows 60%, down from 67% in Q1 2026.
Those swings tell me retailers are still testing the balance, not going all-in. For spec-driven catalogs, keeping standard Shopping alive preserves SKU segmentation control on your highest-margin lines. Both campaign types pull from the same feed, so read these splits alongside our 2026 Google Shopping statistics.
Treat Google's lift figures as targets for your own tests, not forecasts for your account. Each is an average from Google's own data, and each of the three most quoted claims comes with a catch.
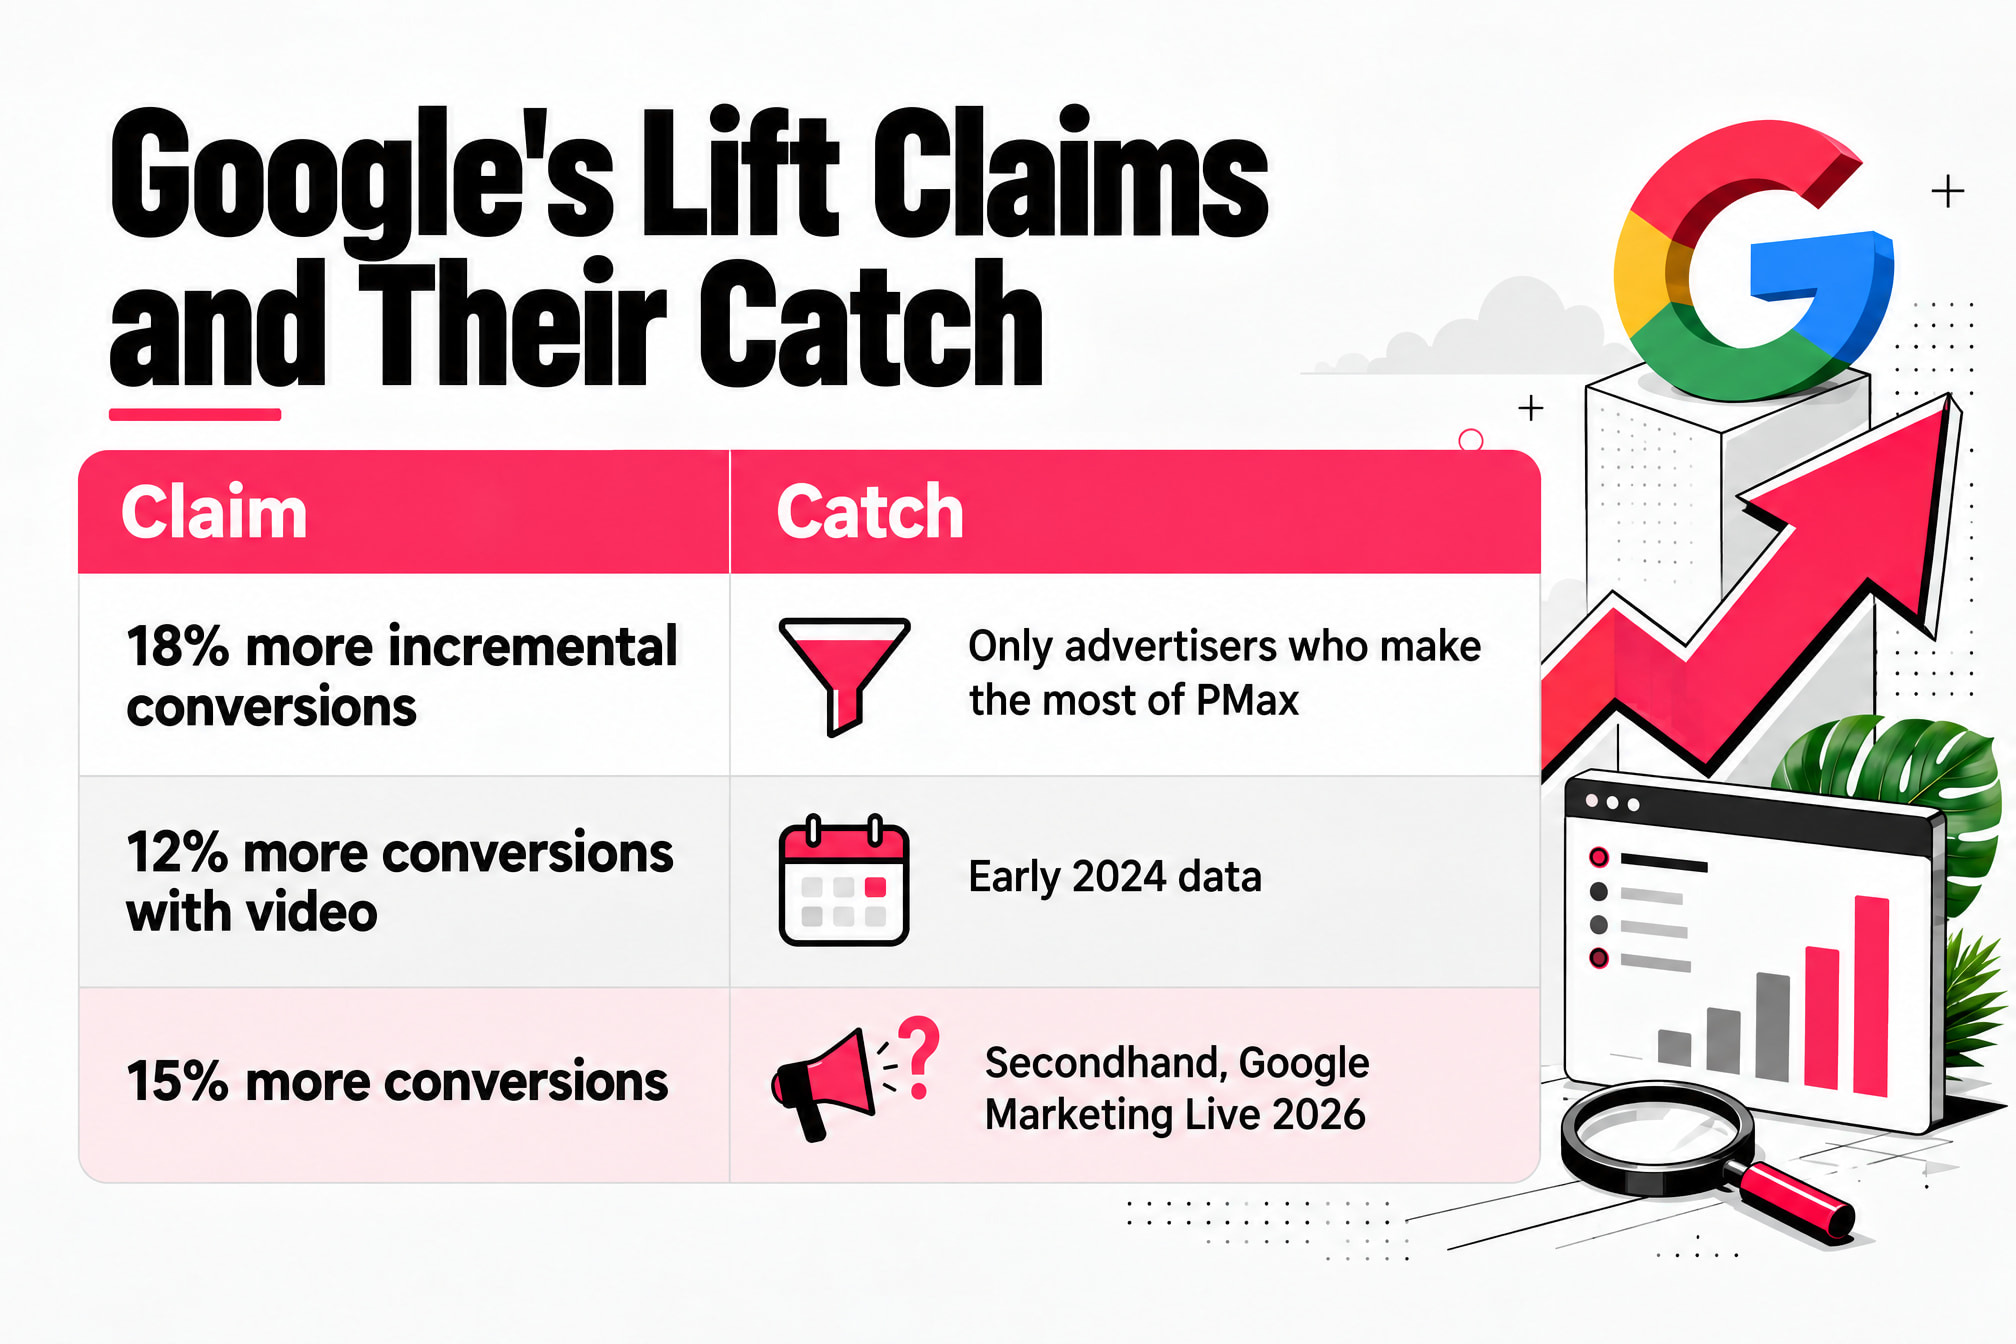
All three averages come from Google's own data, which is why independent tests on your account carry more weight in budget decisions.
Google's figure is an average 18% lift in incremental conversions at a similar CPA. It covers only advertisers who make the most of the campaign type, and that qualifier does a lot of work.
Google reported that advertisers with at least one video in PMax saw an average 12% increase in total conversions. The video could be uploaded or generated by Google AI. The figure dates from early 2024, so cite it with that year attached.
At Google Marketing Live on May 20, 2026, Google reportedly said advertisers adopting AI Max or PMax see 15% more conversions at a similar ROAS. Only secondary sources carry it, and it blends two products. Keep it out of your deck until Google publishes it.
Google's video-shape lift counts YouTube conversions only, so treat it as a creative tip, not a campaign-wide promise. Google says campaigns with horizontal, vertical and square video delivered 20% more conversions on YouTube than campaigns with horizontal video alone.
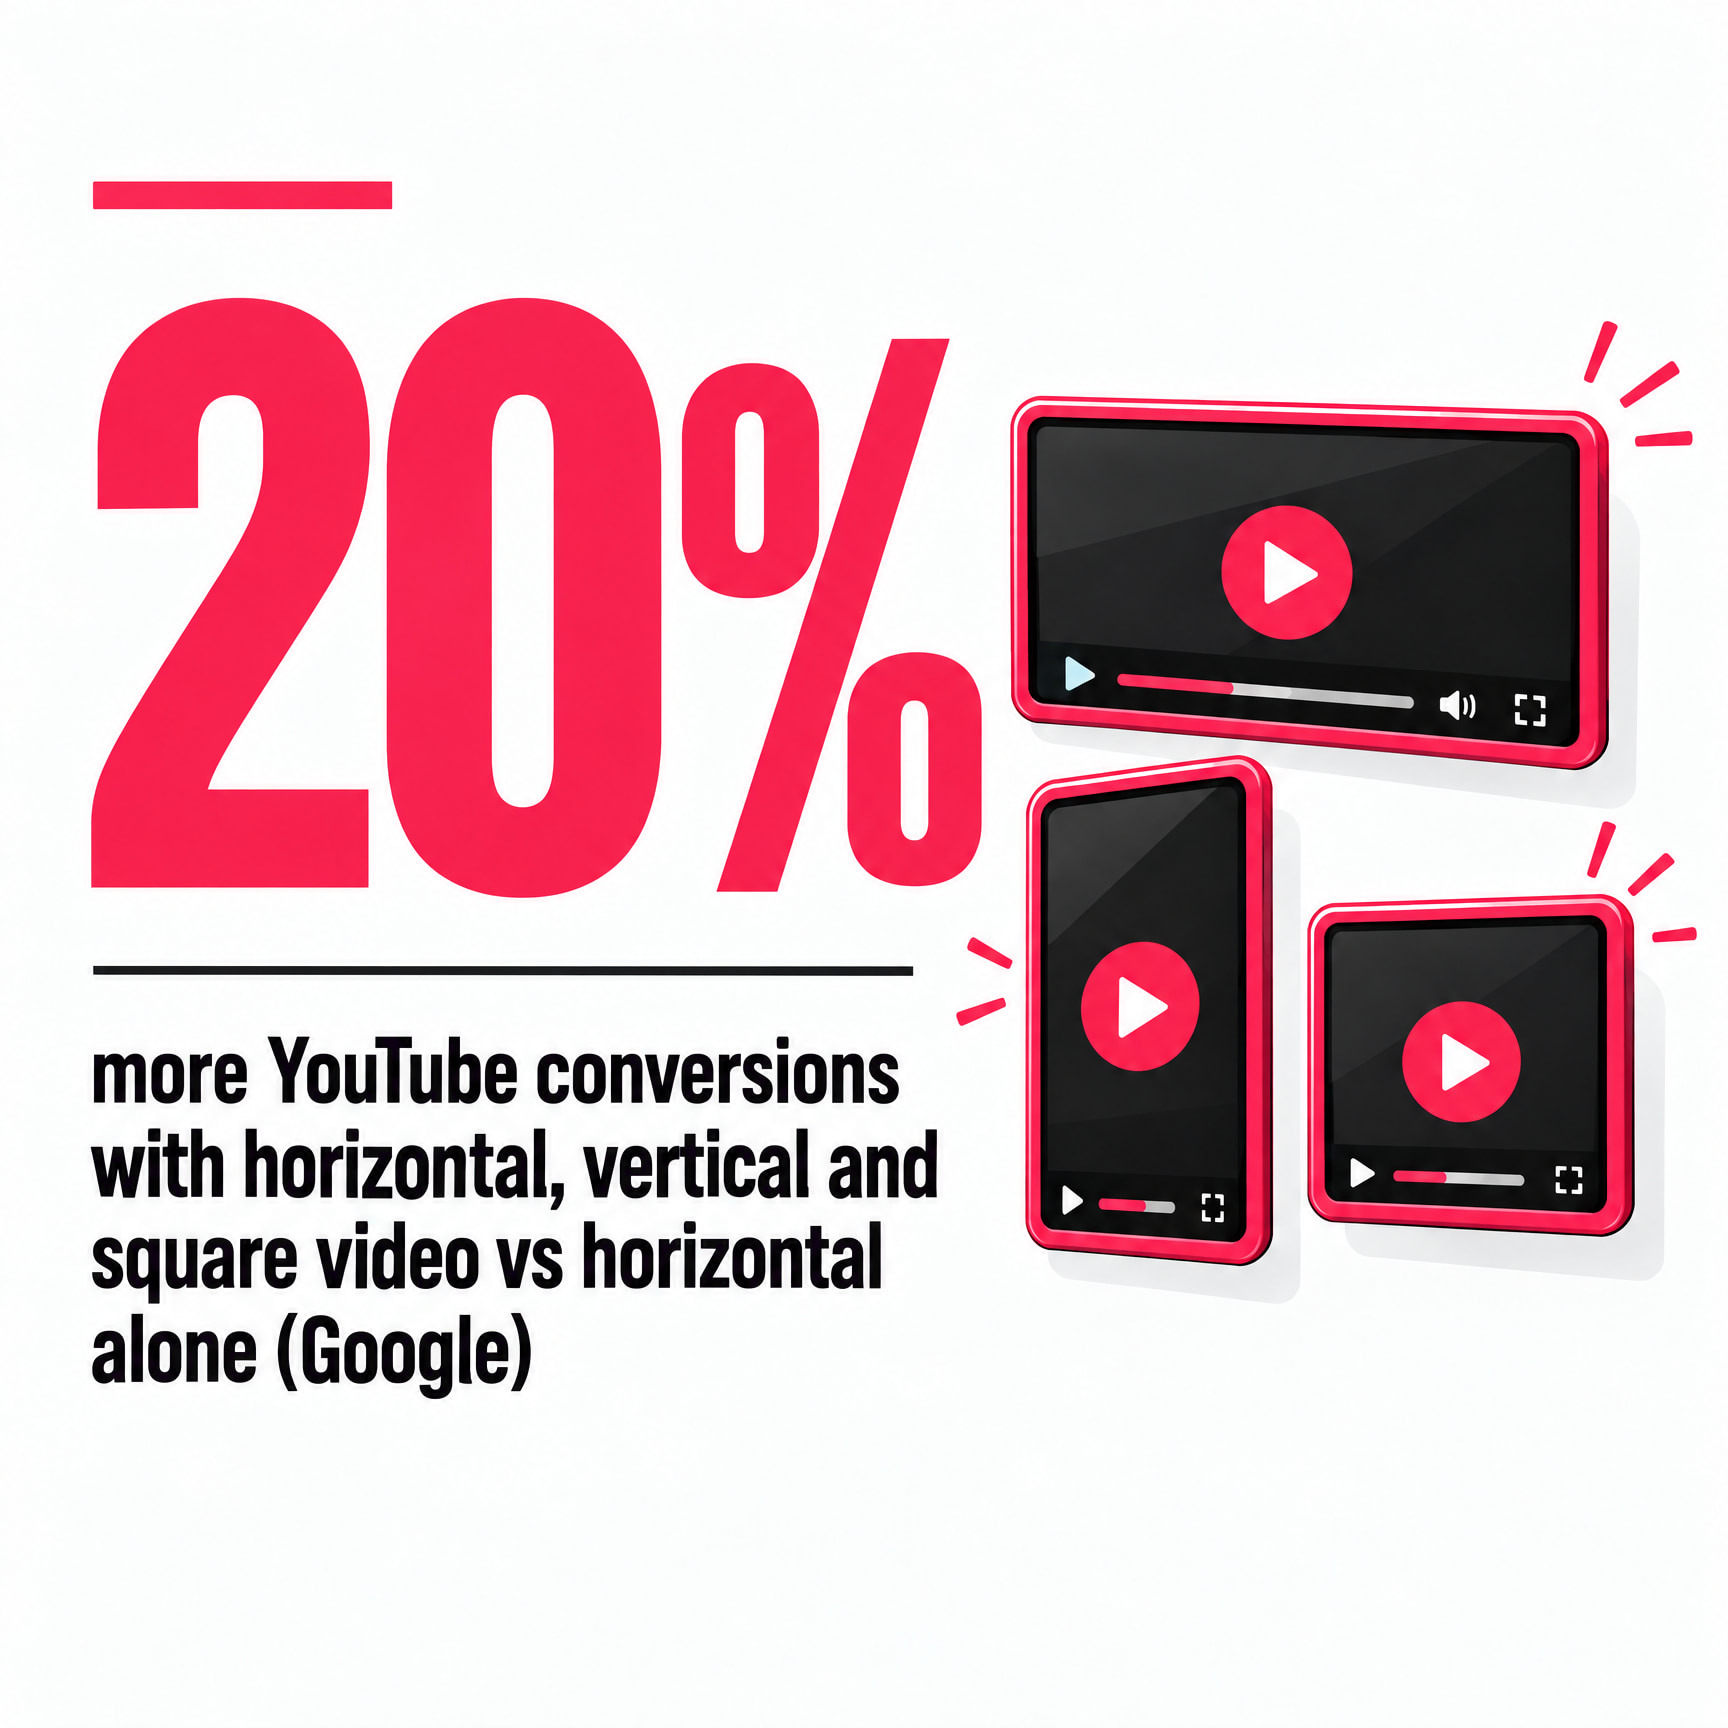
Vertical and square formats fit Shorts and mobile feeds, placements a horizontal-only video can't fill properly.
For spec-driven catalogs, the rest of the asset group matters as much. Real product imagery, clear logos and headlines that name specs or fitment give the algorithm accurate material to assemble. In my view, auto-generated filler describes your category, not your parts. Grouping assets by product line, so a brake kit asset group shows brake kits, is the core of a sound asset group strategy for auto parts PMax campaigns.
Optmyzr's 2026 data is the closest thing to a market benchmark for PMax, and it shows clicks rising faster than returns. Across about 21,000 accounts, Optmyzr's Q1 2026 report logged PMax CTR up 30.2% year over year and CPC up 5.66%. ROAS fell 4.53% over the same period.
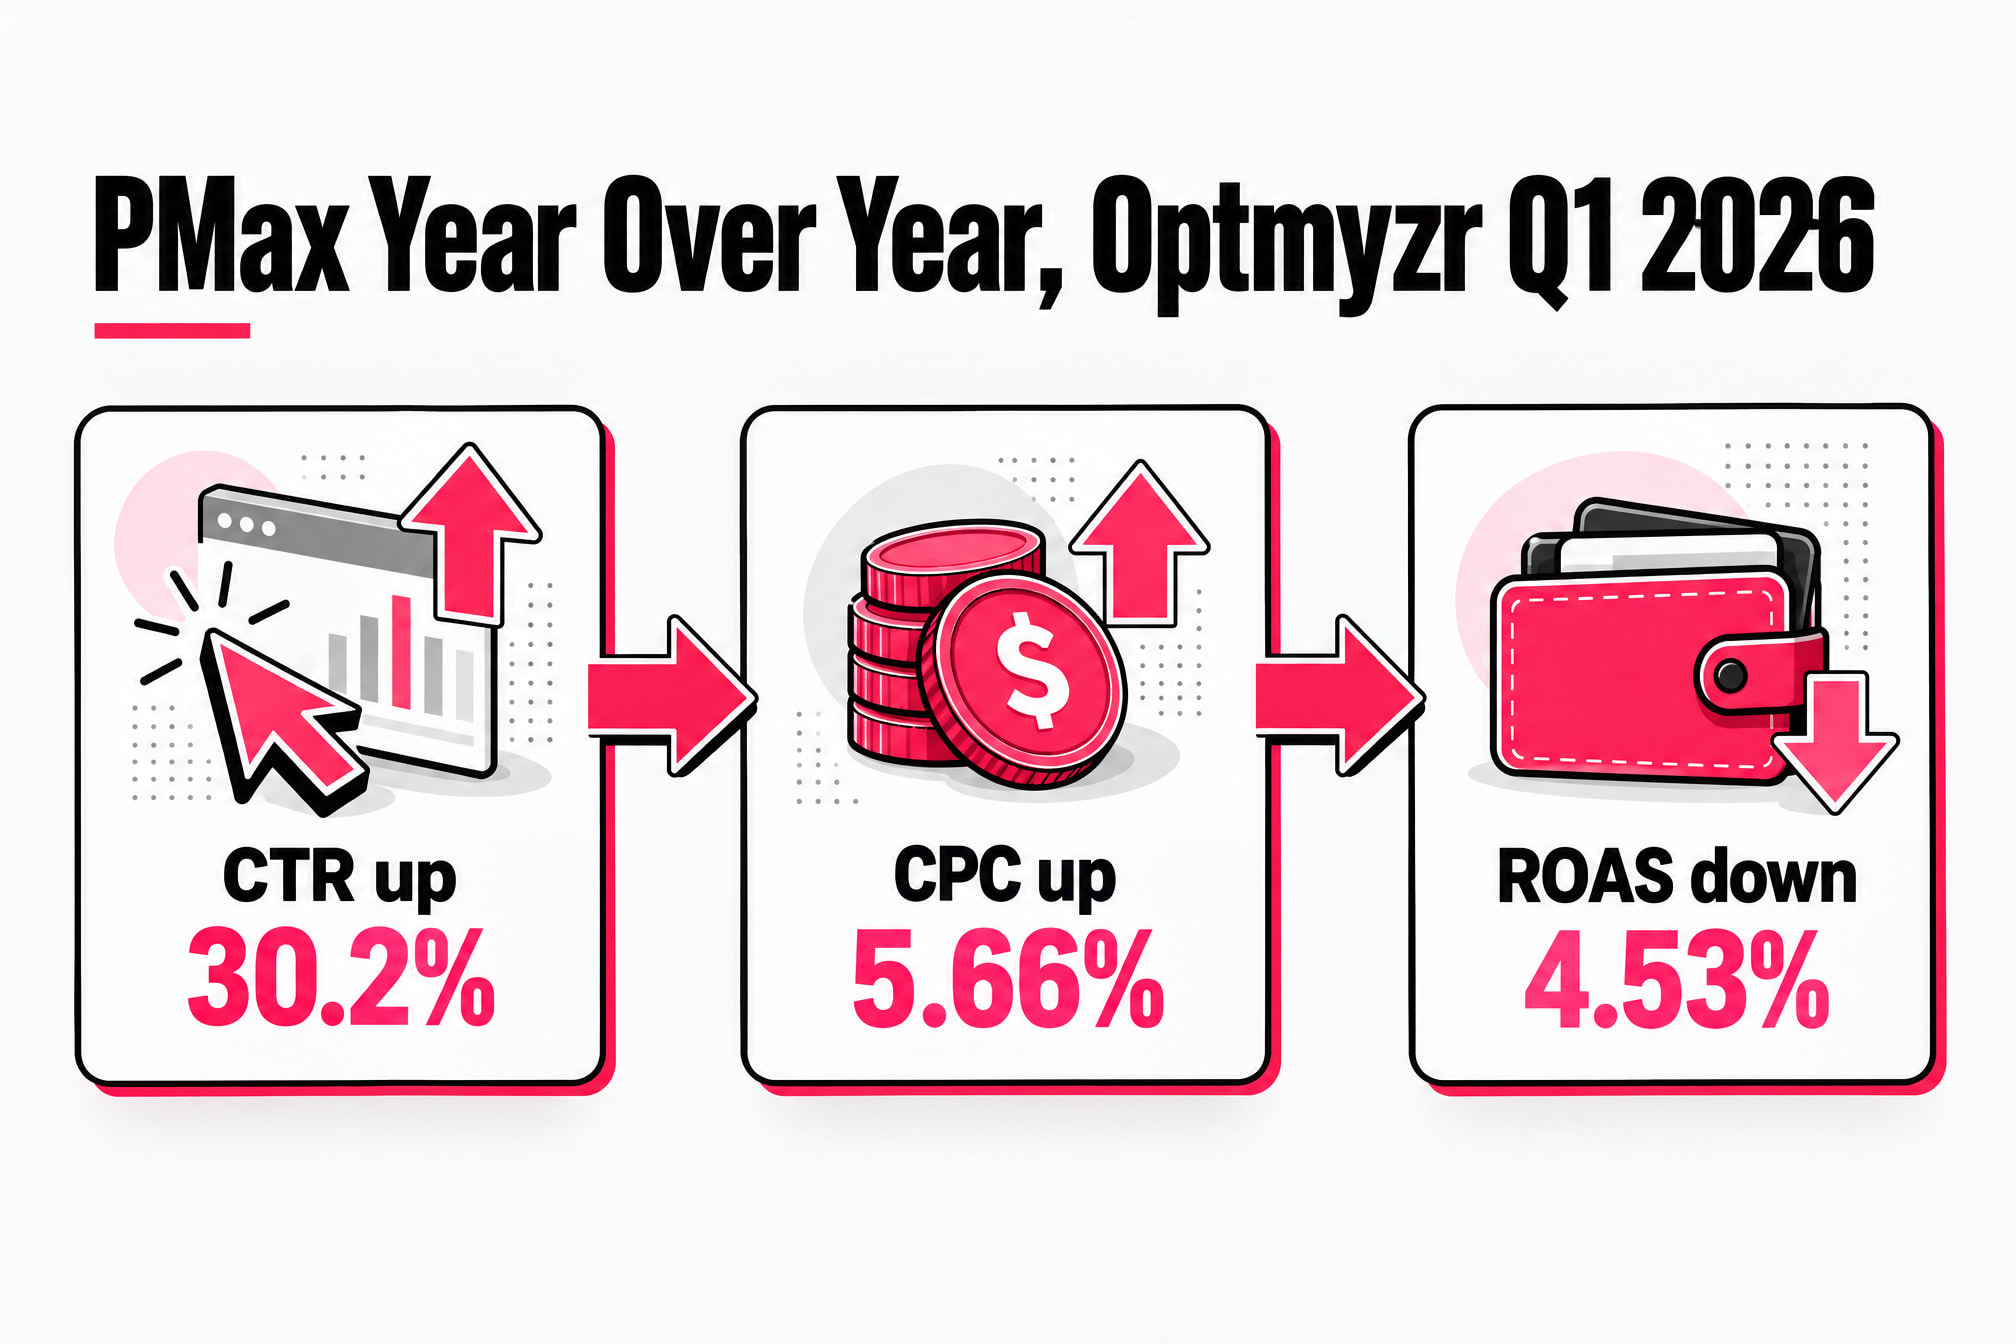
More people click, each click costs more, and the return per dollar slips. If your own PMax ROAS dipped this year, you're in company. The CTR jump is worth setting against broader Google Ads click-through rate statistics for 2026 before you credit or blame PMax alone.
Budget concentration tells a second story. In Optmyzr's study of 24,702 campaigns, 51% of advertisers put more than half their budget into PMax. Those accounts posted the strongest ROAS, at 625.03%, but mixed conversion rate and CPA results. Strong ROAS can hide weak margins.
No authoritative, industry-wide average for PMax ROAS, CPA or CPC is publicly available. For catalog sellers, your own ROAS leans heavily on the Merchant Center feed. Titles with part numbers, attributes and fitment data help PMax match the right SKU to the right search. Thin product data leaves it guessing, and guessing is expensive.
PMax holds its own against standard Shopping on return, while Search keeps the edge on control. The table compares the three on what this roundup can support.
PMax's 60% share of sales matched its 60% share of spend almost exactly. I don't have a citable, market-wide PMax vs Search comparison on CPC or conversion rate. Single-account comparisons are too narrow to benchmark a large catalog against.
The 2025 reporting and control updates answer much of the "black box" complaint. Here they are by date.
One newer feature has no numbers yet. Local customer optimization targets people navigating, trip-planning or searching for locations on Google Maps, Waze or Search. It only works with store goals. It isn't compatible with online goals or PMax campaigns using Merchant Center products, so it won't touch your catalog campaigns. Google's help page for it surfaced in August 2026 with no performance statistics published.
The levers that move PMax results all sit on the advertiser's side of the table. Here's how the work splits.
Bid strategy choice is where catalog sellers win or lose. Maximize Conversions and Target CPA treat every sale as equal. Maximize Conversion Value and Target ROAS chase revenue, which still ignores margin. Passing gross profit as the conversion value turns either into a margin-based bid strategy. That only works with accurate tracking, which is why value-based bidding for ecommerce starts with clean conversion data.
Audience signals and first-party customer lists, such as Customer Match, tell PMax where to start looking. Your past buyers of spec-driven parts are a far better hint than a broad interest category. Full disclosure, feed management and conversion tracking are core services at SCUBE.
None of the sources in this roundup publish a PMax learning-phase length or a minimum budget, so treat any precise figure you see with care. My rule is simple. Judge a new campaign over weeks, not days, and don't restructure it mid-learning.
I'd argue budget size matters more for large catalogs than small ones. Thousands of SKUs split a small daily budget into crumbs. The algorithm then sees too few conversions per product to learn anything useful. With CPCs rising 5.66% year over year in Optmyzr's data, each dollar buys a little less learning than it did in 2025.
For most ecommerce stores with a solid feed, yes. Tinuiti data shows PMax driving 60% of sales at a ROAS similar to standard Shopping in Q2 2026. Optmyzr shows ROAS softening 4.53% year over year, so test it against your own Shopping results.
Performance Max is Google's goal-based, AI-driven campaign type. It runs ads across Search, Shopping, YouTube, Display, Gmail, Discover and Maps from one campaign, using your assets, audience signals and conversion goals.
For a large-catalog PMax campaign, $10 a day rarely gives the algorithm enough conversions to learn which SKUs sell. A small budget works better on a narrow set of best sellers than spread across the full catalog.
Before any of these numbers reach your CFO, sort them into three piles.
Then put your own PMax ROAS and Shopping spend split next to the Optmyzr and Tinuiti figures. If you'd like a second set of eyes on that comparison, the SCUBE team works with large-catalog stores on exactly this.