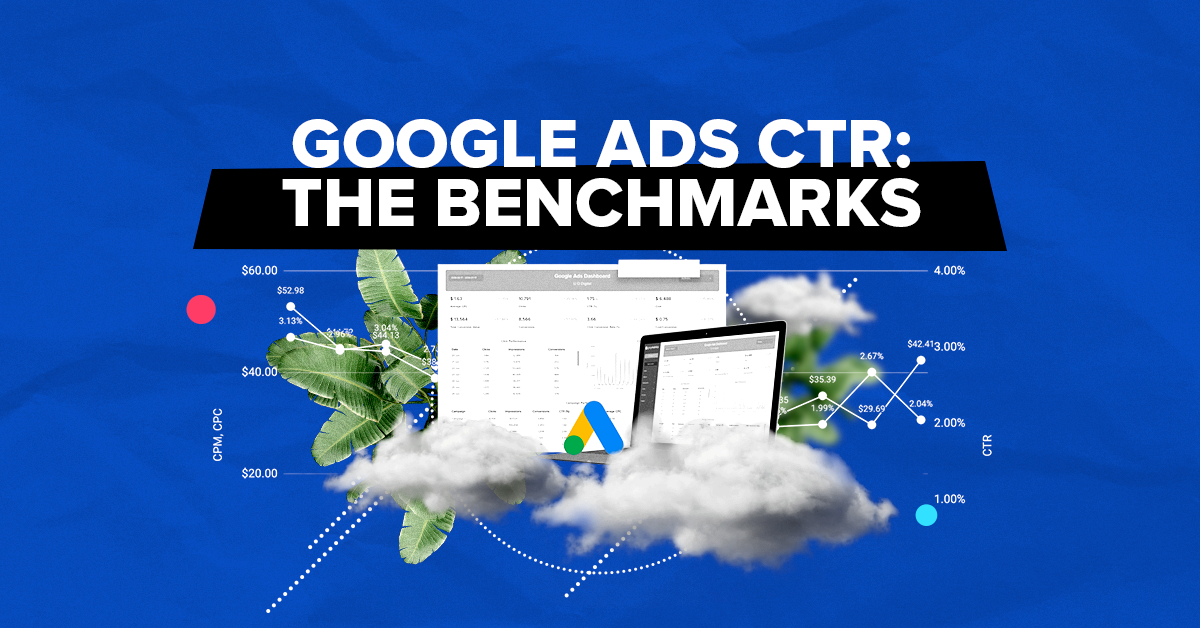
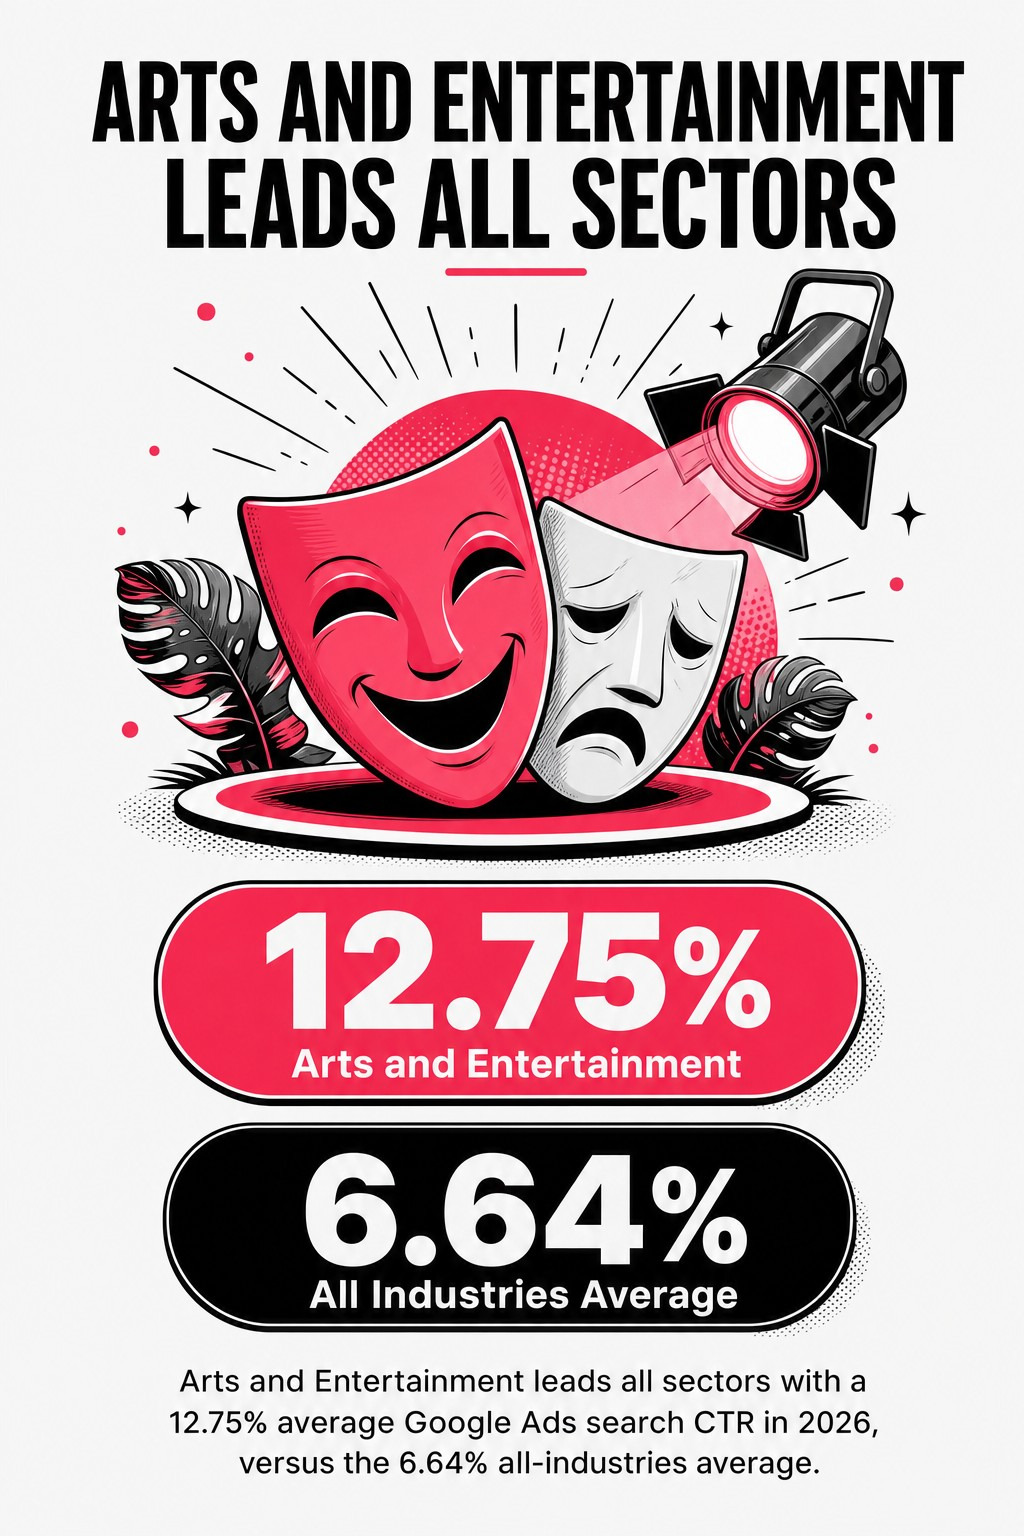
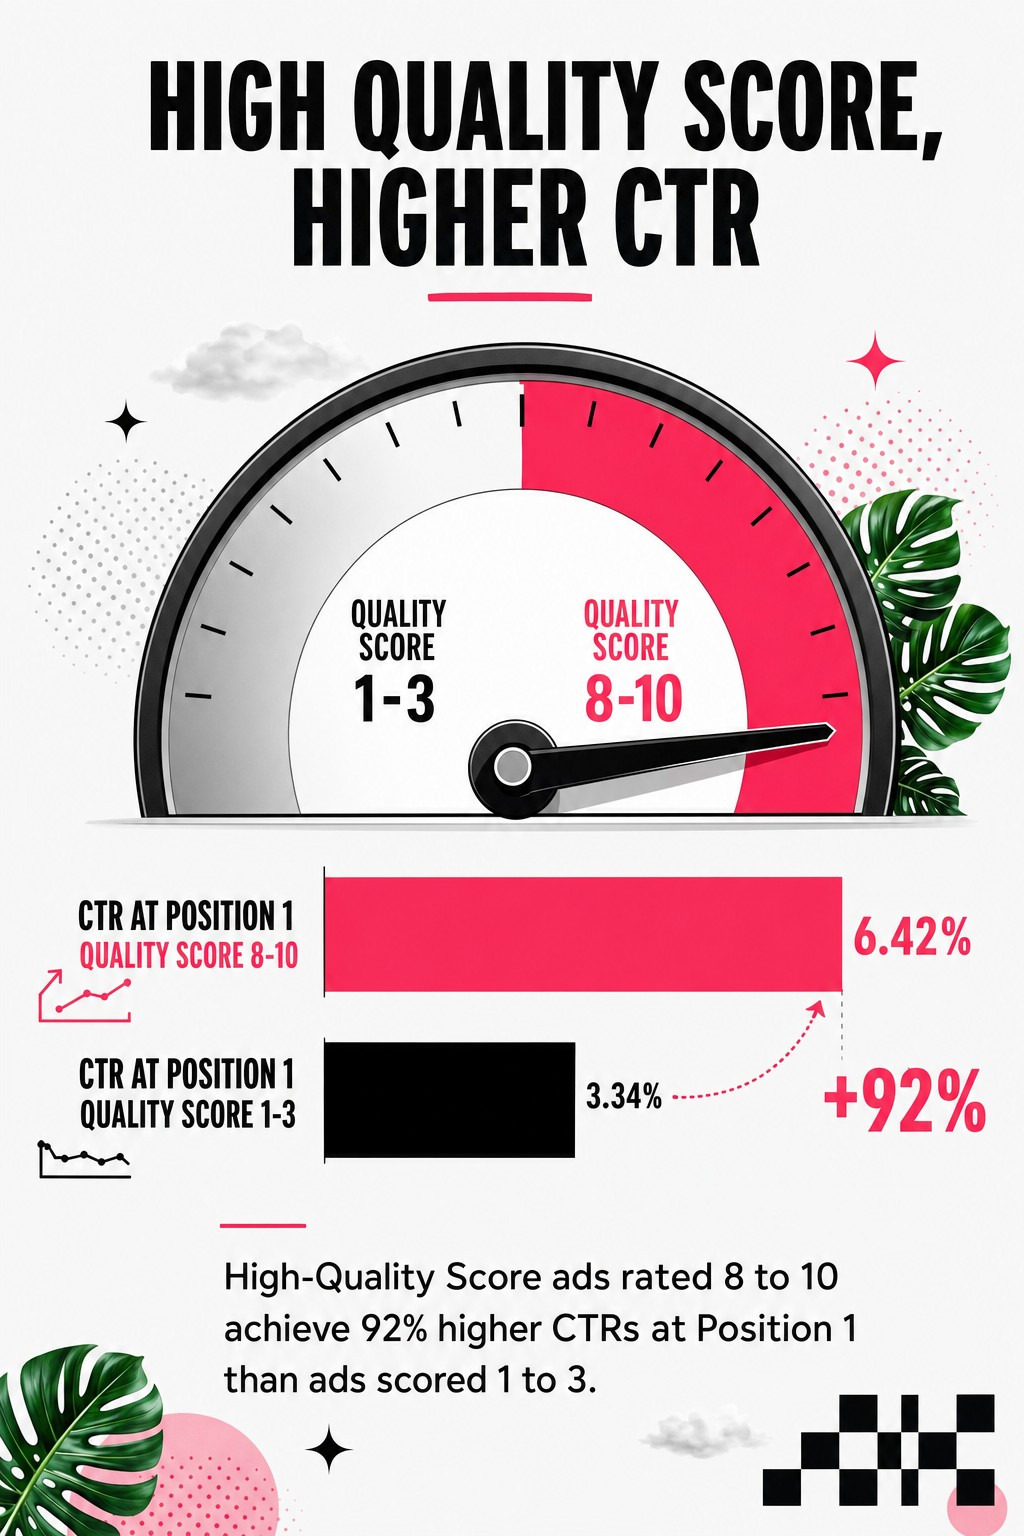
The average Google Ad click-through rates (CTR) in all industries is 6.64% on the search network in 2026. Arts & Entertainment led all other categories at an impressive 12.75%. LocaliQ's industry benchmarks also revealed that the top-ranked paid search ad receives 40% more clicks than second place per rankings research from First Page Sage. Additionally, first-page ads with quality scores of 8-10 received 92% higher CTRs at position 1 compared to those receiving quality score ratings of 1-3. On average, Display and YouTube campaigns averaged about .65% -- an enormous difference when comparing against search.
I work with ecommerce clients in paid search daily, and the biggest mistake I've seen is how many people treat CTR as if it were a single universal measure. It’s not. For example, a 2% CTR on a display campaign is perfectly acceptable while a 2% CTR on a branded search campaign should be considered a serious issue requiring immediate attention. This article will provide the exact benchmarks broken down by category (industry), network (search vs. display), rank (position), and campaign type (branded etc.) to determine what constitutes "acceptable" performance.
Google Ads click-through rate (CTR) measures the percentage of ad impressions that result in a click, calculated by dividing total clicks by total impressions and multiplying by 100.
The formula is straightforward:
CTR = (Clicks / Impressions) x 100
So if your ad received 500 clicks from 10,000 impressions, your CTR is 5%. That single number tells you how often people who saw your ad actually chose to click it.
CTR does more than simply measure traffic volume. It is used by Google as a major component of Quality Score. The quality score will directly affect your Ad Rank and in turn, how much you are paying for each click. If a searcher clicks on an ad at a low frequency then that indicates that your ad did not match the searchers needs or wants. That low frequency of clicks will cost you more money. High frequency of clicks (high CTR) indicates relevancy and relevancy will give you the best placement possible and cost less.
There is one key distinction to consider right up front; CTRs can mean two entirely different things based on the network you're using. The CTR from the search network and the CTR from the display network cannot be compared to each other. They measure different user behaviors.
The average Google Ads search CTR across all industries in 2026 is 6.64%, with meaningful variation across sectors ranging from under 4% to nearly 13% per WordStream's 2026 Google Ads benchmarks.
The table below shows 2026 CTR benchmarks across major industries on the search network:
The Arts and Entertainment figure is striking. At 12.75%, those advertisers are getting a click on nearly one in every eight impressions. That reflects high-intent queries and audiences actively looking for tickets, shows, and experiences. Compare that to automotive parts with a Google Ads CTR of 5.56%, where purchase cycles are longer and searchers compare more before committing.
Search network CTRs average roughly 680% higher than display network performance, because the two channels reach people in completely different mental states.
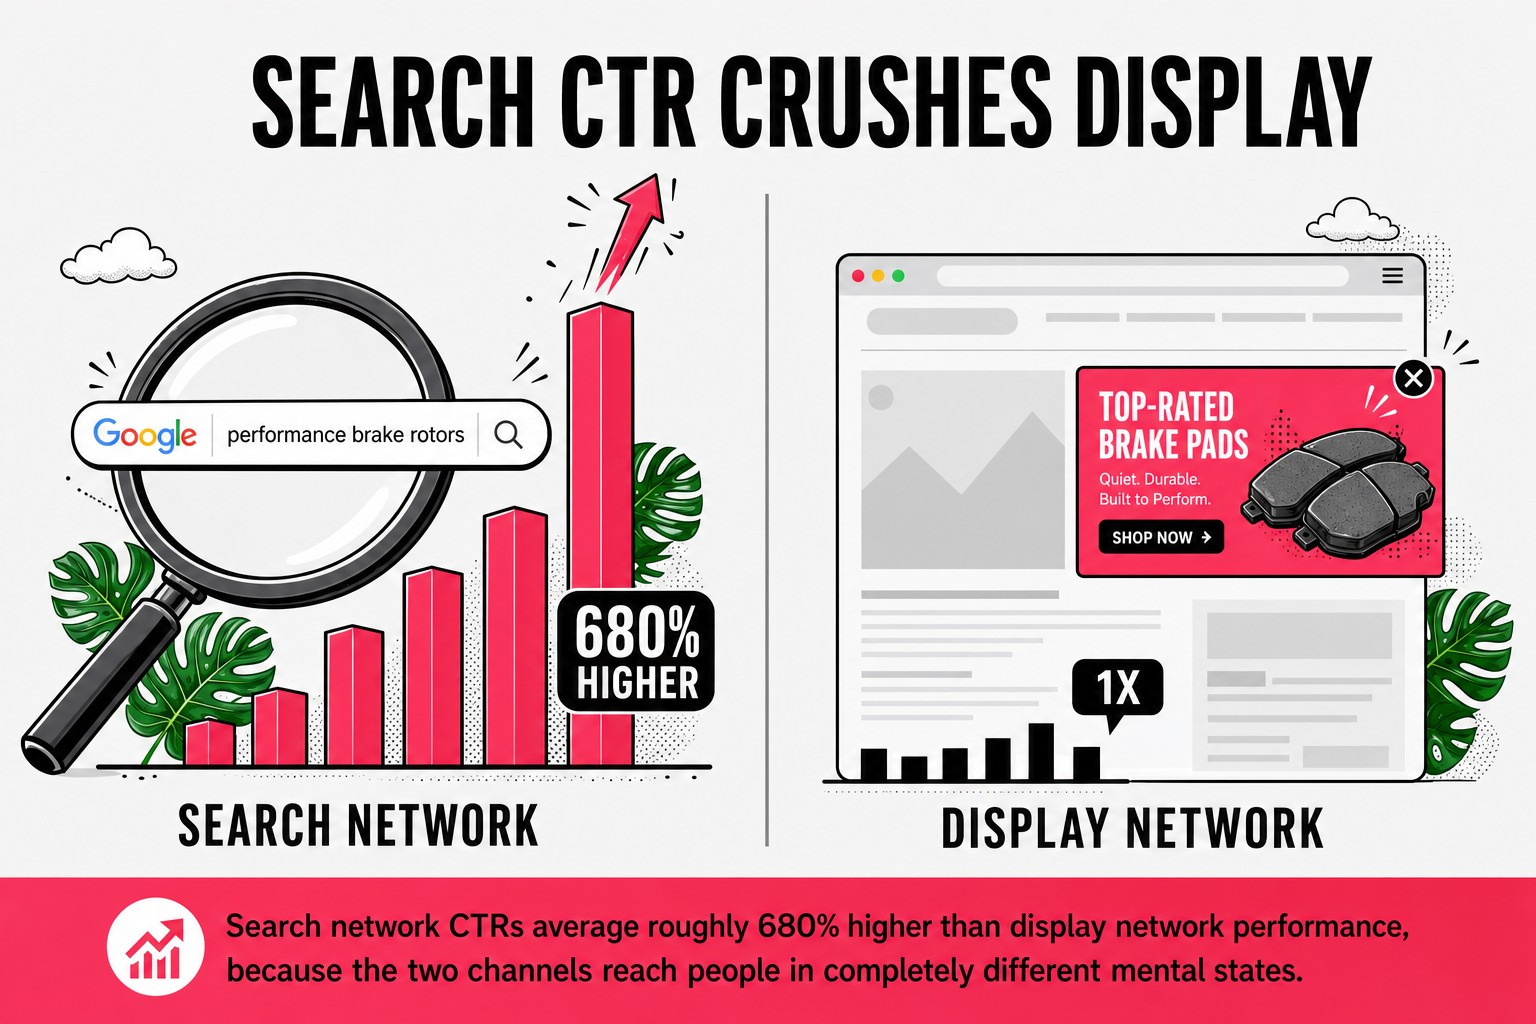
On the search network, someone typed a query. They want something. Your ad appears at the moment of intent, which is why clicks happen. On the display network, your ad interrupts someone reading an article or checking the weather. Display CTRs indicate how much people will tolerate being interrupted; they don't reflect the level of interest in purchasing. Whether or not you have optimized your creative to make it as visually appealing as possible does not bridge this structural gap.
StoreGrowers' Google Ads benchmark analysis has found that the average YouTube CTR is approximately 0.65%. This 0.65% CTR also represents display advertising as a whole. That 0.65% isn't a bad number for display. It's the expected number for a channel where users didn't ask to see your ad.
In terms of implications for real world practice, I would recommend creating two separate reporting systems for your display and search metrics. If you blend both into one report entitled “Account CTR” then that metric means nothing in regard to measuring the effectiveness of either channel.
Different Google Ads campaign types operate in different environments, and their click-through rates reflect that:
Performance Max deserves a specific note. Its blended CTR can look misleading if you don't break it down by asset group and placement type. Broad account-level CTR from a PMax campaign mixing YouTube inventory with search terms isn't a clean signal either way.
A “good” Google Ads click-through rate on the search network is at or above the 6.64% all-industry average, with branded campaigns expected to clear 20% and non-branded campaigns performing well at 5% or higher.
These aren't universal rules, but they give you a starting point that accounts for the structural difference between branded and non-branded keyword CTR.
Branded keywords get clicked at dramatically higher rates than non-branded terms. When someone searches your company name, they already want you. That intent produces CTRs of 20% to 35%+ in many categories. Non-branded keywords carry more comparison behavior, which naturally suppresses click rates.
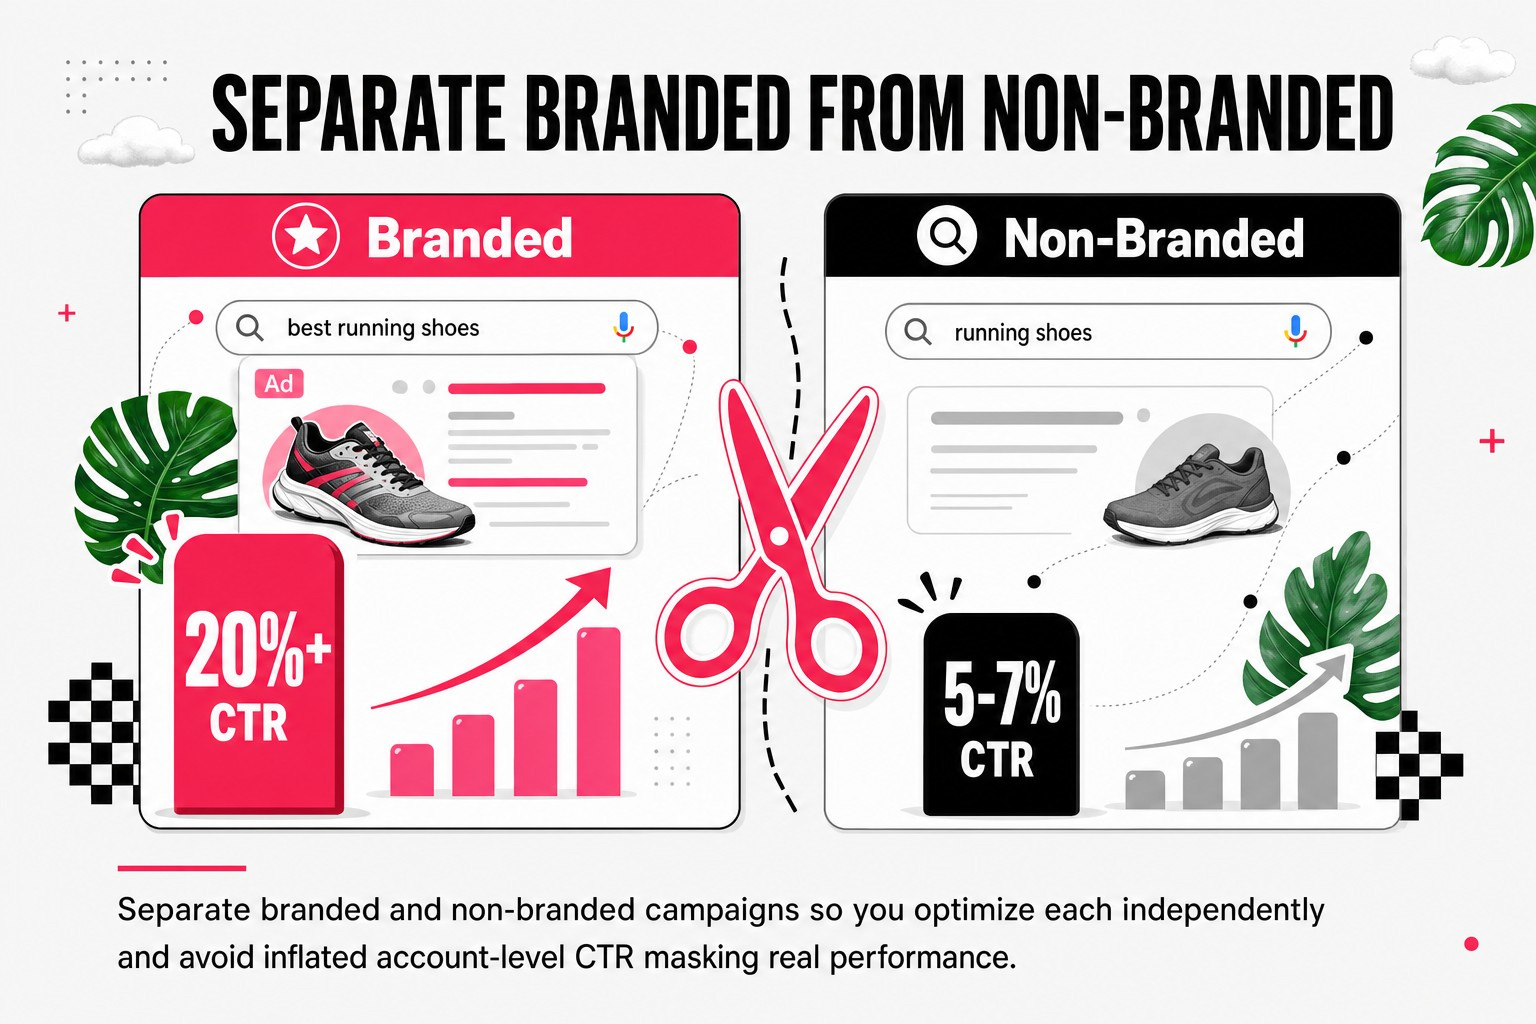
This means mixing branded and non-branded campaigns into a single CTR report inflates your apparent performance. Separate them. A non-branded campaign averaging 6% to 7% CTR is genuinely outperforming most competitors. A branded campaign averaging 12% has a problem worth diagnosing.
Position matters enormously. The top paid search result earns a 40% higher CTR than the #2 position per First Page Sage's CTR by ranking position report. That gap compounds down the page.
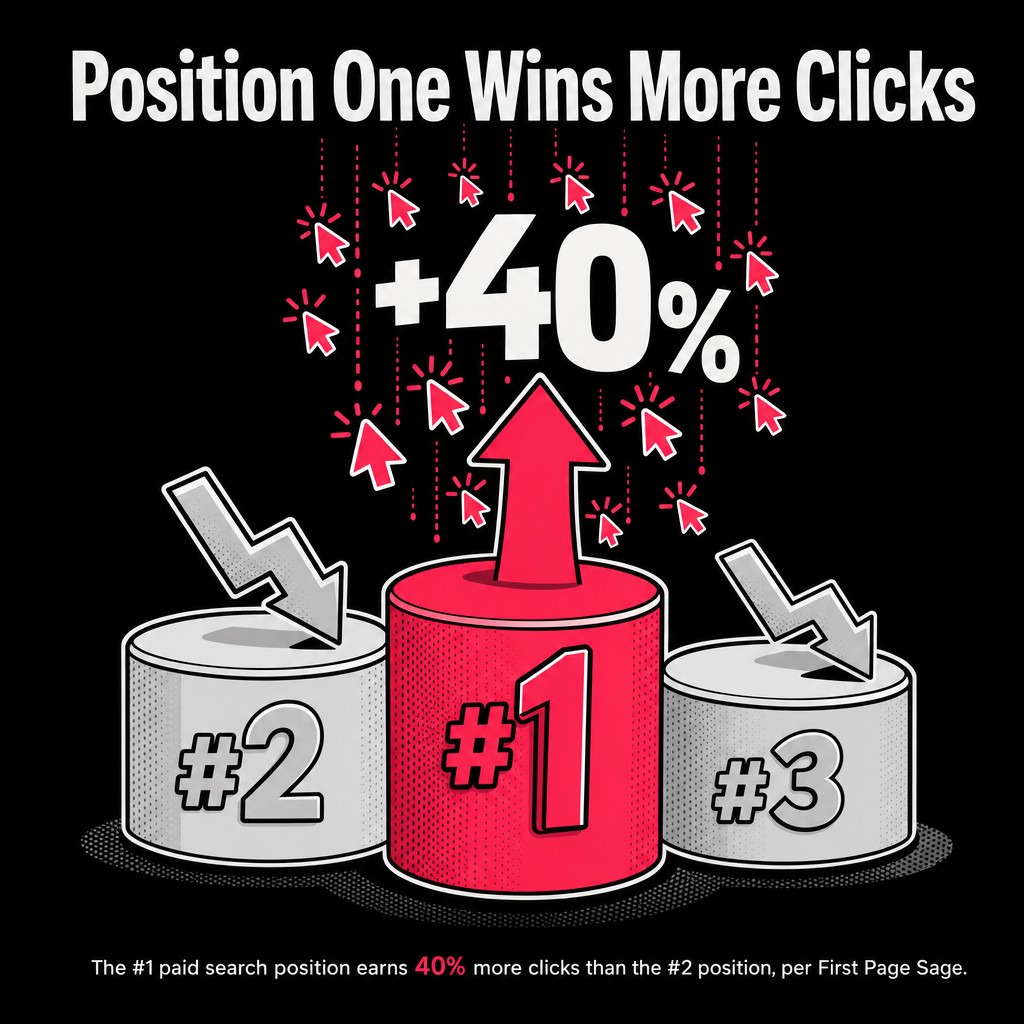
Positions 3 & 4 have substantially lower CTRs. For many advertisers, the benefit of saving money with lower CPC from positions 3 & 4 is outweighed by lost clicks. But, AI Overviews are adding a new layer here. By October 2025, Google Ads appeared on 25.56% of search results that included AI Overviews according to Semrush's SERP analysis. Organic listings lose click share when AI Overviews answer queries directly, and that displaced intent flows into paid placements. Brands running strong search campaigns in commercial categories are actually gaining reachable inventory as a result.
Google Ads click through rates (CTR) can be influenced by multiple factors; however, the greatest influences will generally relate to ad position, keyword intent, ad copy relevancy, as well as how many ad extensions an advertiser uses.
Advertisers often underestimate the role of keyword intent in their ads. For example, "buy running shoes size 10" will have a very different click through rate (CTR) potential than "what are running shoes made of." "What are running shoes made of," is an information-seeking query, and 91.3% of all search queries that triggered AI overviews in January 2025 were informational, based on Semrush's recent commercial search study, which found that this type of query is now being increasingly answered before a user ever clicks on a link. Commercial and transactional searches still produce strong paid CTRs.
The wording of your ad copy determines if a user clicks your ad or continues to scroll. Ad copy with headlines that mirror the language of the search query, clearly define a value proposition, and highlight specific advantages of your product/service will perform better than generic copy. This is a fact. That is why conducting A/B tests on Google Ads headlines typically results in measurable CTR increases.
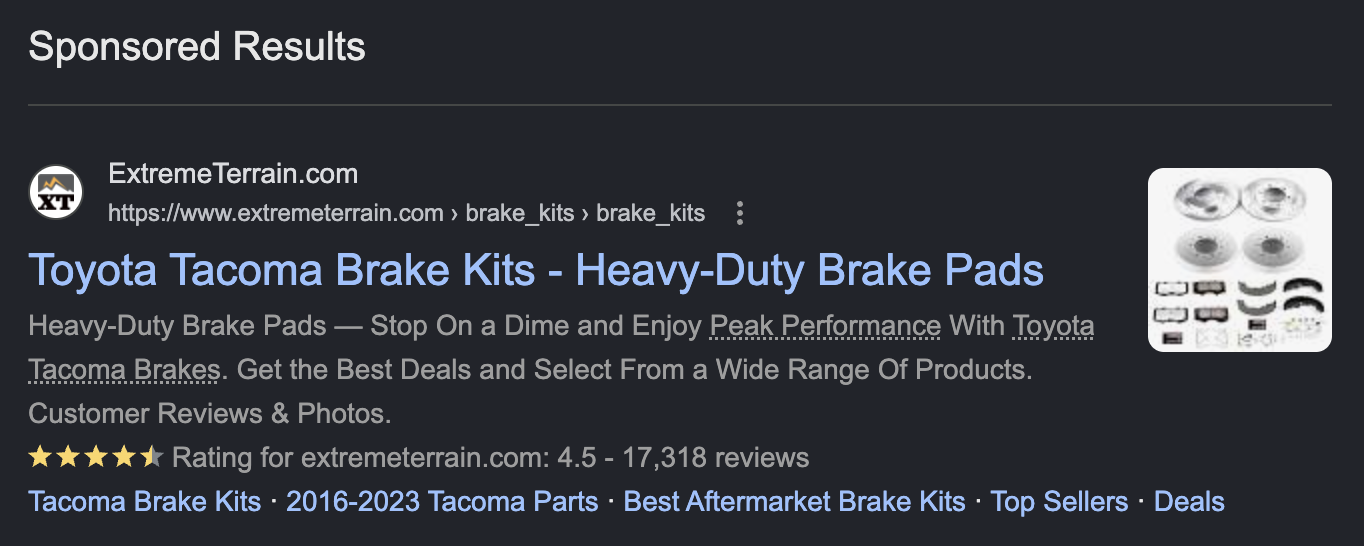
Increasing your ad's presence on the Search Engine Results Page (SERP) is done with ad extensions. Sitelinks, callouts, and structured snippets provide users with additional reasons to click and also create more places to click. A Google Ads account with four active sitelink extensions will display significantly larger than a standard text-based ad account. And it is this increased real estate on the SERP that leads to higher CTRs.
Negative keywords reduce CTR. When your ad appears for irrelevant queries, impressions climb while clicks stay flat, pushing CTR down. Tighter keyword targeting keeps your ad in front of people who actually want what you're selling.
Google Ads click-through rate is one of the three core components of Quality Score, alongside ad relevance and landing page experience. Quality Score directly determines Ad Rank and cost per click.
Google's Quality Score uses expected CTR as its heaviest weighted factor. A high expected CTR tells Google your ad matches what users want, which earns better Ad Rank at lower bids. A low expected CTR signals a mismatch, and Google charges a premium to compensate.
Moving from Quality Score 4 to Quality Score 7 can reduce CPC by 30% to 50% per Stackmatix's Quality Score optimization analysis. On a $10,000 monthly budget, that difference is $3,000 to $5,000 staying in your account instead of going to Google.
High-Quality Score ads rated 8 to 10 achieve 92% higher CTRs at Position 1 compared to ads scored 1 to 3 per Focus Digital's CTR analysis. The relationship is self-reinforcing: better CTR raises Quality Score, higher Quality Score improves Ad Rank, better Ad Rank produces higher CTR. Getting into that positive loop is the goal.
The current average cost-per-click (CPC) for PPC ads has increased over 2X in just ten years. This is due to the increasing number of people bidding on keywords. The Ad Spend has reported an increase in CPC from $2.32 to $5.42 as per their historical CPC data. The cost to obtain a click will continue to grow.
The average conversion rate across Google Ads in 2026 sits at 8.18% per WordStream's benchmark data. If you have a higher CTR, but lower conversion rates it may be that your ads attract unqualified visitors.
On the other hand if you have a lower CTR, but a higher conversion rate, that means you're leaving qualified traffic on the table. The primary area that needs focus is CTR. For a broader look at how to connect these metrics in your overall paid search approach, the five essentials of ecommerce paid search strategy covers how CTR fits into the full acquisition picture.
Google Ads click-through rate improves most reliably through a combination of tighter keyword targeting, stronger headline relevance, and systematic use of ad extensions, with each change producing measurable results when tested in isolation.
These are the levers that consistently move the needle on CTR across ecommerce campaigns. And avoiding the most common PPC management mistakes is often the fastest CTR win available.
Bidding strategy also connects directly to CTR. Smarter bid management keeps your ads in positions where clicks happen, rather than positions where they don't. The data-driven bidding strategies guide covers how to structure bids around CTR and Quality Score signals rather than cost alone.
The average Google Ads click-through rate across all industries on the search network is 6.64% in 2026. Display and YouTube CTRs average around 0.65%. These two numbers should never be compared directly because they measure different user behaviors.
A good CTR for non-branded search campaigns is 5% or higher. Hitting 6.64% or above on non-branded traffic means you're outperforming the average account. Branded campaigns should clear 20%. Industry context matters: Arts and Entertainment advertisers averaging 12.75% CTR are at a completely different baseline than automotive parts sellers.
Display ads reach people who didn't ask to see them. Search ads reach people mid-query. The intent gap is structural, not a creative problem. Search network CTRs run roughly 680% higher than display on average, and no amount of optimization closes a gap that large because the two channels serve fundamentally different audience states.
Expected CTR is the primary component of Quality Score in Google Ads. A strong expected CTR raises Quality Score, which improves Ad Rank and reduces cost per click. Moving from Quality Score 4 to Quality Score 7 can cut CPC by 30% to 50%. The relationship between CTR, Quality Score, Ad Rank, and CPC is circular: improving one improves the others.
AI Overviews absorb clicks that previously went to organic results. Paid placements gain share as a result. By October 2025, Google Ads appeared on 25.56% of SERPs containing AI Overviews, and paid text ad click share more than doubled in some high-intent product categories in a single year. Brands running active search campaigns are benefiting from this shift. Brands relying on organic traffic in commercial categories are losing share to both AI Overviews and the paid ads that now accompany them.
A healthy Google Shopping CTR ranges from 1–3%, with well-optimized feeds achieving 3–5%.
Shopping campaigns with quality imagery and product feeds usually outperform the average click-through rate (ctr) of the all-industry text ad. However, CTR can vary greatly based on what assets are being used in a specific asset group. Since Performance Max uses both search and display/video inventory and will blend CTR across those channels into a single ctr metric; it can mask how well each channel is performing within the account. Before drawing any conclusions as to the performance of CTR from a Performance Max campaign, break-down CTR metrics by placement-type.