

ROAS tells you what revenue came back for each ad dollar spent. But it doesn't tell you if those dollars were actually necessary, if you're cannibalizing organic sales, or if your most profitable customer segments are getting ignored. Equipment dealers face longer sales cycles and higher-value transactions than most eCommerce businesses. A single metric can't capture whether your $5,000 in ad spend actually drove that $50,000 excavator sale, or if the customer was coming anyway.
I've watched dealers celebrate a 10:1 ROAS while missing the fact that their inventory turns were slowing. Their data showed advertising success, but their business was bleeding cash into unsold equipment.
The fundamental problem is that ROAS measures correlation, not causation. It credits ads for sales that might have happened regardless. For equipment dealers handling high-value machinery and equipment in agricultural, industrial, and commercial sectors, this distinction matters enormously.
You need analytics that connect advertising performance to inventory management, customer lifetime value, market demand signals, and true incrementality. This means tracking metrics that reveal whether your marketing actually changed customer behavior or just took credit for existing demand.
We'll examine why ROAS creates dangerous blind spots for equipment dealers. Then I'll show you the specific analytics frameworks that reveal true campaign impact, optimize inventory decisions, and build predictable growth in a market where single transactions can make or break your quarter.
ROAS quantifies revenue generated per advertising dollar. That's valuable baseline information.
But equipment dealerships don't operate like typical eCommerce businesses. Your customers research for months before purchasing. They compare specs across multiple visits. They talk to sales teams, arrange financing, and coordinate delivery logistics.
A dealer might run ads targeting skid steers in March. A customer clicks, browses, leaves. They return via organic search in April, call the sales team in May, and finally purchase in June after visiting the showroom twice.
Standard ROAS measurement typically uses last-click attribution. The June organic visit gets credit. The March ad that started the entire journey gets nothing.
This creates three specific problems for equipment dealers tracking campaign performance.
Most advertising platforms use 30-day attribution windows by default. Your equipment sales cycles often run 60, 90, or 120 days for larger machinery purchases.
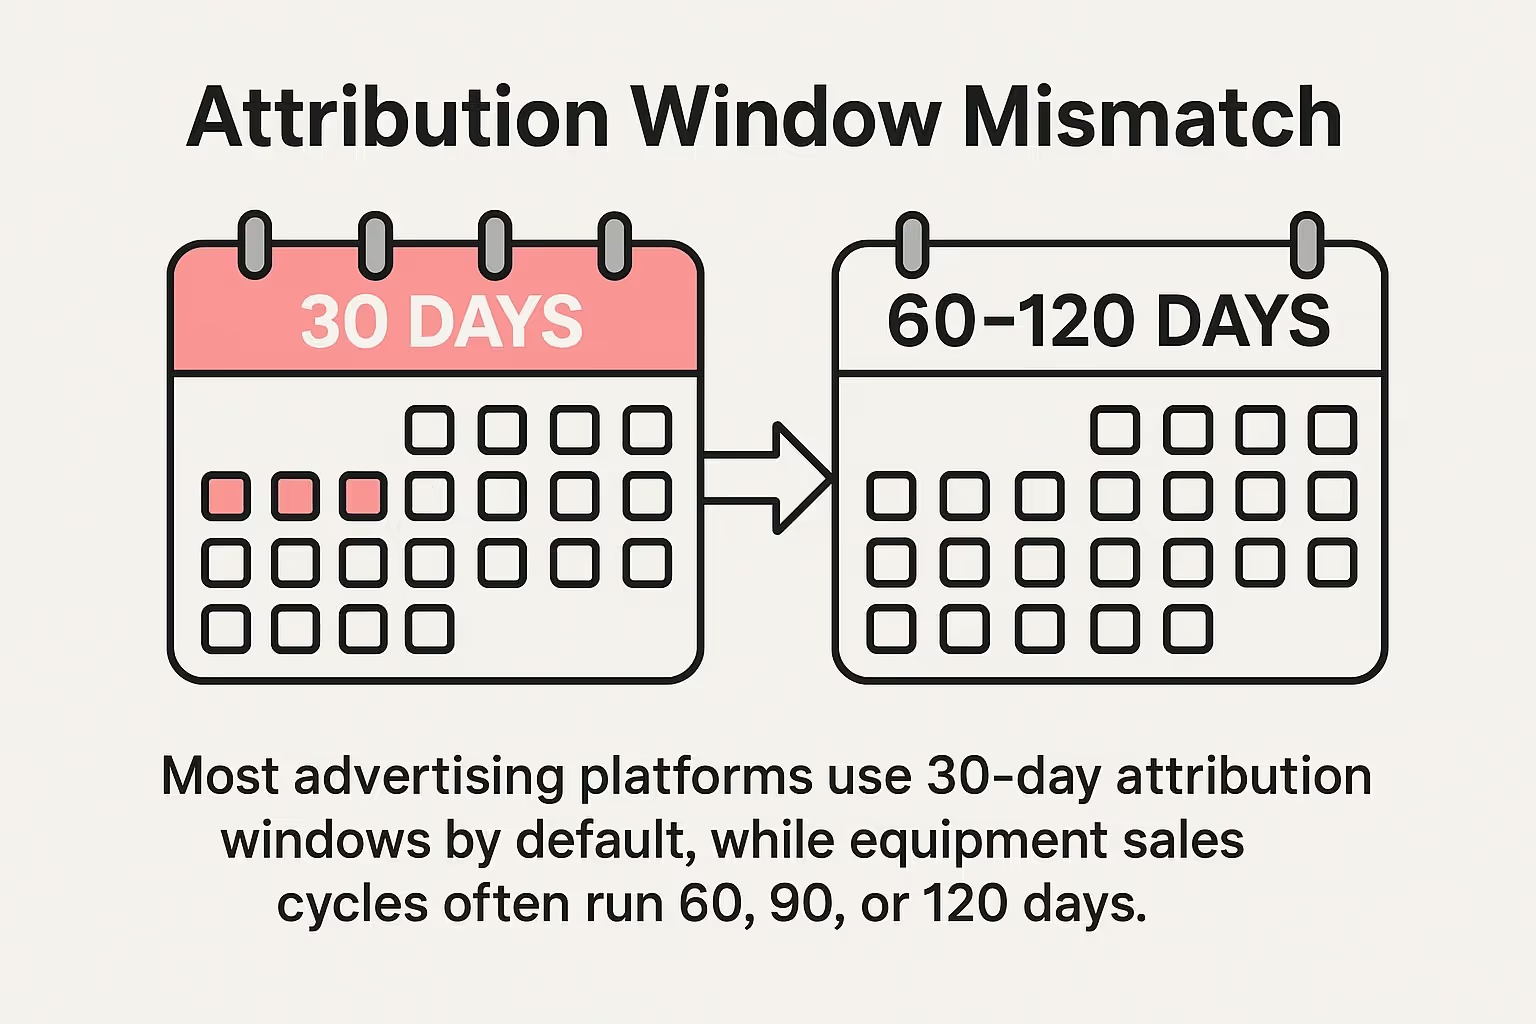
Attribution windows often miss long sales cycles. Align measurement with 60–120 day realities for equipment purchases.
The platform reports a disappointing 2:1 ROAS because it can't see the deals that closed outside its tracking window. You cut budget on campaigns that were actually working.
I've seen dealers slash spending on their most effective awareness campaigns because the analytics couldn't connect early-stage research behavior to eventual purchases. The data showed failure when reality showed success.
ROAS treats all revenue equally. A $20,000 compact tractor sale and a $20,000 attachment package show identical ROAS numbers.
But the tractor might carry a 12% margin while the attachments deliver 35%. One campaign generates $2,400 in gross profit. The other generates $7,000.
Your ROAS metrics show equal performance. Your profitability tells a completely different story. Focusing solely on return on ad spend without considering profit margins leads to budget allocation that maximizes revenue but minimizes actual earnings.
High ROAS looks impressive. But it doesn't answer the critical question: would these sales have happened anyway?
If you're advertising your dealership name in branded search campaigns, you'll see excellent ROAS. You're capturing customers who already decided to buy from you. The ads didn't create demand, they just intercepted existing intent.
Non-incremental campaigns show strong metrics but deliver no actual growth. You're paying to capture sales that were already coming your way. The opportunity cost is real: those dollars could have funded campaigns that actually expanded your customer base.
When equipment dealers optimize exclusively for ROAS, they make systematically bad decisions. The metrics look good in reports, but the business suffers in ways that don't immediately show up in advertising dashboards.
These hidden costs accumulate slowly. Then they compound.
Campaigns targeting customers ready to buy generate the best ROAS numbers. They're low-risk conversions with clear attribution and short sales cycles.
So ROAS-focused dealers allocate more budget there. They bid aggressively on model-specific searches and competitor comparisons. The metrics look fantastic.
But you're not creating new demand. You're fighting over the existing pool of in-market buyers. Your customer acquisition costs rise as you compete harder for the same audience.
Meanwhile, you're under-investing in awareness campaigns that introduce your dealership to buyers who don't yet know they need equipment. You're starving the top of your funnel while over-feeding the bottom.
Three months later, your bottom-funnel campaigns start showing diminishing returns. The audience is tapped out. You have fewer new prospects entering your pipeline.
ROAS data shows which equipment categories generate the best advertising returns. Many dealers use this to inform inventory purchasing decisions.
The problem is that advertising performance reflects demand you're creating through marketing spend, not total market demand. If you're running heavy campaigns for compact tractors, they'll show strong ROAS. So you stock more compact tractors.
But maybe the real opportunity is in utility vehicles where you're under-advertised and under-stocked. The market wants them, but your analytics don't show it because you're not creating visibility there.
You end up with inventory decisions based on advertising success rather than actual market demand. Understanding broader customer behavior patterns prevents this misalignment by incorporating data beyond campaign performance.
ROAS measures first purchase value. It doesn't account for repeat business, parts sales, service revenue, or referrals.
A customer who buys one piece of equipment might return for three more over five years, plus regular maintenance. Another customer makes a single purchase and never returns.
From a ROAS perspective, they look identical if the initial transaction values match. From a business perspective, one customer is worth five times more.
When you optimize campaigns for ROAS, you're optimizing for initial transaction value. You're not building a customer base that generates sustainable revenue growth.
Incrementality measurement answers the question ROAS can't: would this sale have happened without the advertising?
It's the difference between correlation and causation. ROAS shows what happened after you ran ads. Incrementality reveals what happened because you ran ads.
For equipment dealers, this distinction determines whether your marketing budget is driving growth or just documenting sales that were already coming.
The gold standard is geo-holdout testing. You divide similar markets into test and control groups. Run campaigns in test markets, suppress them in control markets, then compare sales performance.
If your test markets show 20% higher sales than control markets, that 20% represents incremental impact. That's growth you actually created.
The math gets more sophisticated when you account for market differences, seasonal variations, and inventory availability. But the core principle stays simple: true impact equals what happened minus what would have happened anyway.
I've seen this reveal that branded search campaigns (which show excellent ROAS) deliver almost zero incrementality. The customers were coming regardless. Meanwhile, seemingly inefficient awareness campaigns were driving substantial incremental growth.
Full geo-holdout tests require scale that not every dealer has. But you can still measure incrementality through simpler methods.
Run periodic campaign blackout tests. Turn off specific campaigns for two weeks while maintaining others. Compare sales patterns during the blackout period against historical baselines.
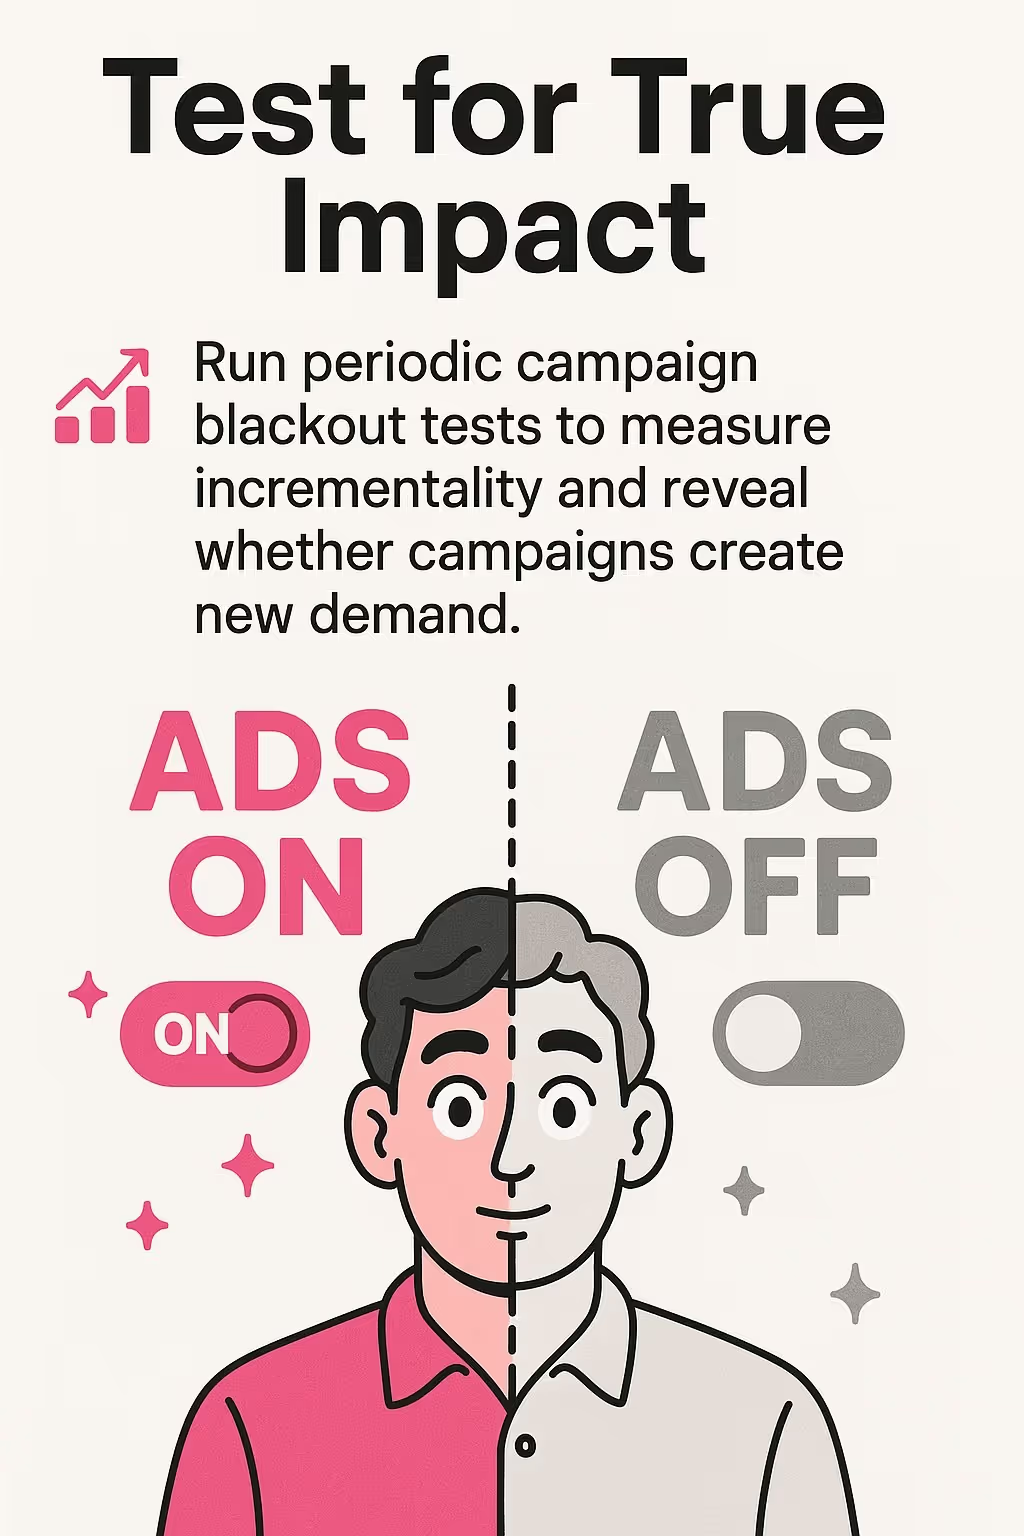
Run short blackout tests to isolate true incremental lift and separate demand creation from demand capture.
If sales drop significantly when campaigns pause, you've got strong incrementality. If sales barely change, those campaigns were capturing existing demand rather than creating new demand.
Track new customer acquisition separately from repeat business. ROAS might look identical for both segments, but incrementality differs dramatically. New customer campaigns create actual growth. Repeat customer campaigns often just accelerate purchases that were coming anyway.
Monitor competitive conquest rates. When you target competitors' customers, what percentage actually switch? This reveals whether your campaigns are expanding your market share or just maintaining visibility among people already comparing options.
Once you understand which campaigns drive incremental sales, budget allocation becomes clearer. You're not optimizing for the best ROAS numbers. You're optimizing for the biggest impact on actual business growth.
High-incrementality campaigns deserve budget even when ROAS looks mediocre. They're creating new customers and expanding your addressable market.
Low-incrementality campaigns need scrutiny even when ROAS looks strong. You might be overpaying to capture sales that were already coming to you.
Effective budget management balances efficiency metrics like ROAS with growth metrics like incrementality to build sustainable performance.
Equipment dealers operate in a relationship business. Initial sales are important, but the real value comes from repeat purchases, service contracts, parts sales, and referrals over years.
Your analytics need to reflect this reality. That means tracking metrics that measure customer relationships, not just transactions.
Start with cohort analysis. Group customers by the month they made their first purchase. Track their total spending over the next 12, 24, and 36 months.
Include everything: equipment purchases, parts orders, service appointments, accessory sales, financing revenue. Many dealers only track major equipment sales in their CLV calculations. That dramatically understates actual customer value.
Calculate average purchase frequency. How often do customers return? Equipment purchases might happen every few years, but parts and service create regular touchpoints.
Factor in referral value. In the equipment dealer world, word-of-mouth drives substantial business. A customer who refers three others has much higher lifetime value than their direct purchases indicate.
The resulting CLV metric gives you a completely different picture than ROAS. Some campaigns attract high-value customers who return frequently. Others attract one-time buyers who never engage again. ROAS treats them the same. CLV shows the truth.
Track customer retention by cohort. What percentage of customers who purchased in 2023 have returned for any transaction in 2024?
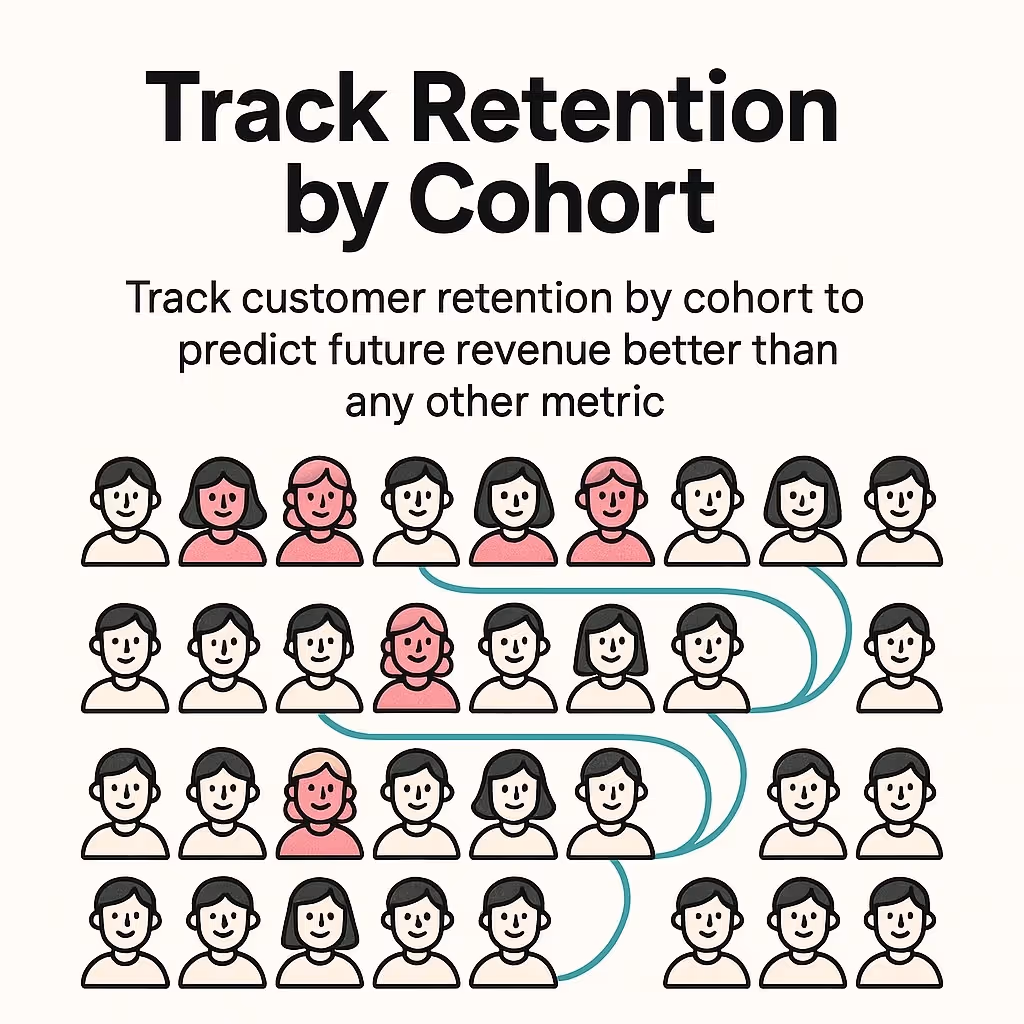
Track retention by cohort to forecast revenue and identify which acquisition sources create loyal customers.
Retention rate predicts future revenue better than any other metric. High retention means your customer base compounds over time. Each year's new customers add to an engaged base that keeps buying.
Low retention means you're constantly rebuilding. You need continuous new customer acquisition just to maintain revenue levels.
Connect retention rates back to acquisition channels. Measure which traffic sources and campaigns bring customers who stick around versus those who churn after one transaction.
This reveals whether your advertising is building a valuable customer base or just generating one-off sales. The difference matters enormously for long-term business health.
What percentage of equipment buyers return for service? This metric indicates relationship depth.
Customers who use your service department are substantially more likely to buy their next piece of equipment from you. They're engaged with your dealership beyond the initial transaction.
Track service attachment rates by acquisition source. Some campaigns attract customers who become fully engaged with your dealership. Others bring price shoppers who buy once and disappear.
Optimize for service attachment, not just initial ROAS. You're building a business, not just processing transactions.
Equipment inventory represents massive capital investment. The used construction equipment market is valued at USD 131.38 billion in 2024, demonstrating the scale dealers operate in.
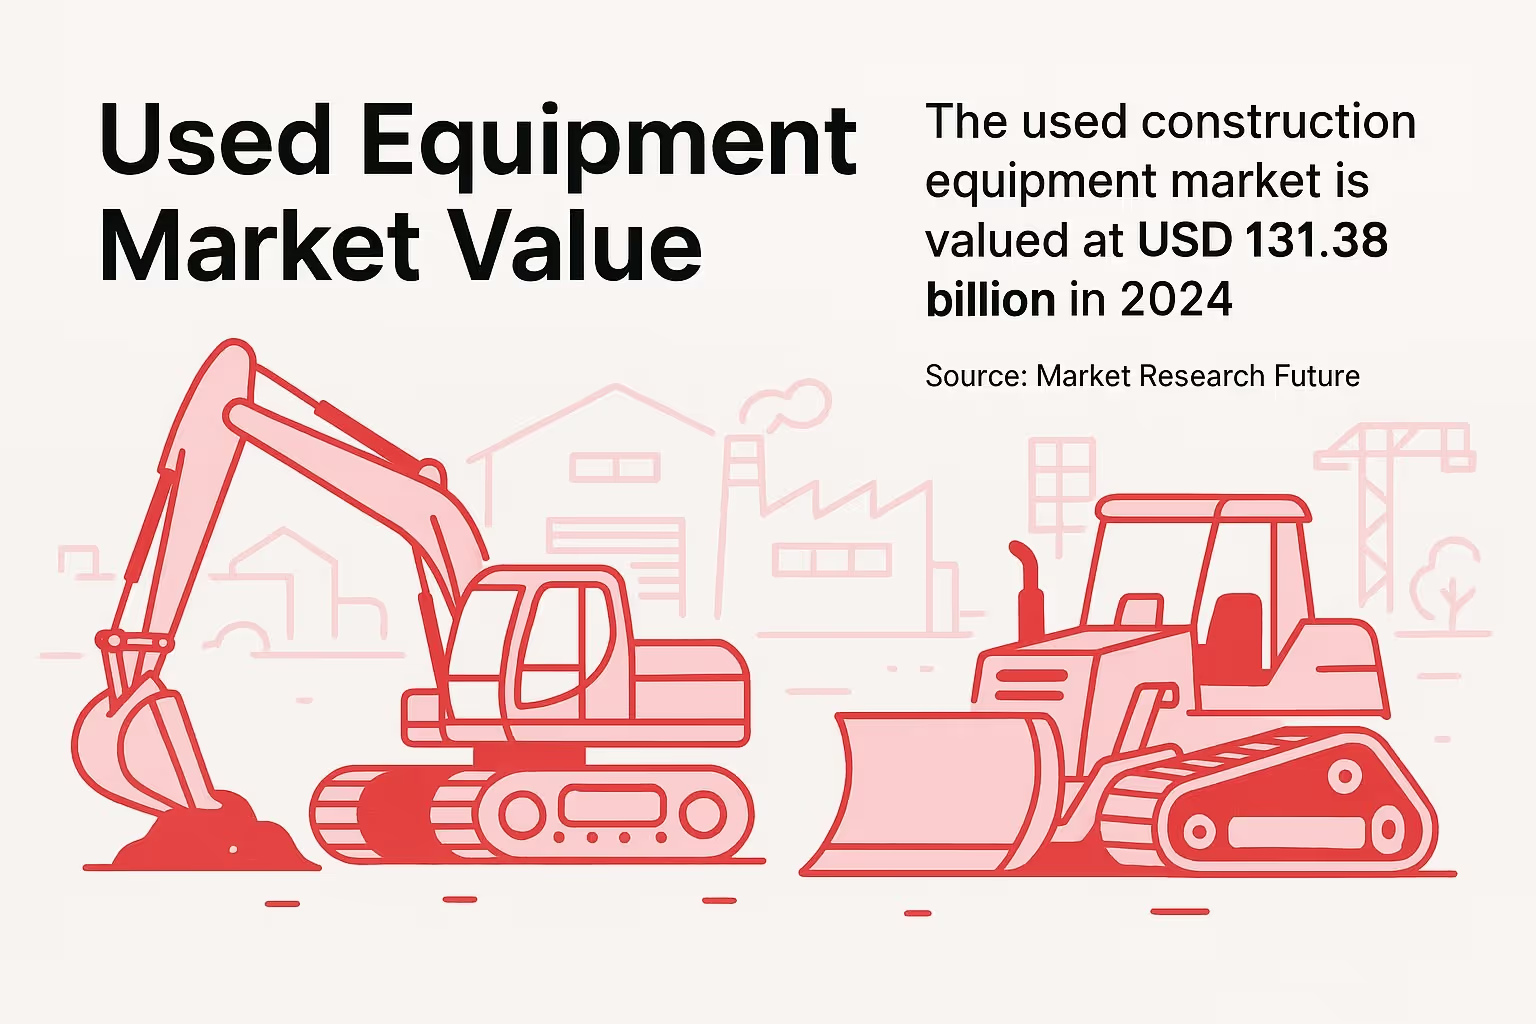
Used construction equipment is a USD 131.38B market in 2024—align inventory and marketing to where demand truly exists.
Your analytics need to connect advertising performance to inventory decisions. This prevents the common mistake of stocking based on what advertises well rather than what the market actually demands.
Track search volume trends for different equipment categories. Use tools like Google Keyword Planner to monitor monthly search patterns.
Compare search demand against your inventory levels. Are you stocked heavily in categories where search interest is declining? Are you under-stocked in categories showing growth?
Monitor how long specific equipment types sit in inventory. Faster turns indicate strong market demand. Slow turns suggest misalignment between your stock and current market interest.
Connect this inventory data back to your advertising performance metrics. Sometimes poor ROAS happens because you're advertising equipment that's not currently in demand. Sometimes strong ROAS masks the fact that you're under-stocked and missing additional sales opportunities.
Track how your pricing compares to market rates. Use competitive monitoring tools to see where your prices sit relative to other dealers.
Analyze conversion rates by price position. Do you convert better when you're priced at market rate, slightly below, or significantly below? The answer varies by equipment type and customer segment.
Monitor how price changes affect advertising performance. Sometimes improving ROAS is as simple as adjusting pricing to be more competitive. Other times, holding price and targeting different customer segments works better.
Calculate price elasticity for different equipment categories. Some items are price-sensitive: small decreases drive large volume increases. Others are feature-driven: customers pay for specific capabilities regardless of modest price differences.
Calculate return on inventory investment alongside ROAS. This shows whether your capital is deployed effectively.
If a piece of equipment generates strong ROAS but sits for 180 days before selling, your inventory ROI is poor. Your capital was tied up too long. That same money could have turned faster in different equipment.
If another piece shows mediocre ROAS but turns in 30 days, your inventory ROI might be excellent. You're generating steady returns on quickly recycled capital.
Comprehensive reporting tools help connect advertising performance to inventory efficiency, revealing the full picture of profitability.
Moving beyond ROAS requires integrated analytics that connect advertising performance to business outcomes. This means bringing together data from multiple sources into a unified measurement framework.
Start with your advertising platforms. Pull data from Google Ads, Facebook Ads, and any other channels you use. This provides the advertising performance baseline.
Connect your dealership management system. This contains sales data, customer records, service history, parts purchases, and financing information. It's the source of truth for actual business outcomes.
Integrate inventory management data. Track what's in stock, how long items have been on the lot, turn rates, and supplier costs. This connects advertising to operational efficiency.
Add your CRM system. Tools like Salesforce or industry-specific platforms track customer interactions, sales pipeline, and relationship depth.
Include financial data. Gross margins, operating costs, and profitability by product line complete the picture.
Use Google Data Studio or similar business intelligence platforms to create unified dashboards. These pull data from multiple sources into single views.
Design dashboards around decision-making needs, not just data availability. Your marketing team needs different views than your inventory manager or finance department.
Create a campaign performance dashboard that shows ROAS alongside incrementality estimates, customer acquisition cost, average customer lifetime value by channel, profit per customer, and inventory impact.
Build an inventory optimization dashboard connecting search demand trends, current stock levels, advertising performance by category, days on lot, and gross margin by equipment type.
Develop a customer value dashboard tracking cohort retention rates, lifetime value by acquisition source, service attachment rates, referral generation, and repeat purchase patterns.
Document how you calculate each metric. ROAS seems straightforward until you start asking questions about attribution windows, how to handle financing revenue, and whether to include trade-in values.
Create consistent definitions. Does "customer lifetime value" include service revenue? Parts sales? Financing income? Whatever you decide, apply it consistently so you can compare performance over time.
Set appropriate measurement windows. Don't judge campaign performance on 30-day data when your sales cycle runs 90 days. Moving from analytics to action requires matching your measurement timeframes to your actual business rhythms.
Establish review cadences. Some metrics need daily monitoring. Others make sense weekly or monthly. Build regular review processes that match the metric's natural cycle.
The real value of analytics beyond ROAS comes when you shift from reporting what happened to predicting what will happen. This transforms data from a scorecard into a strategic tool.
Analyze historical patterns to forecast future demand. Equipment sales follow seasonal patterns. Construction equipment peaks in spring. Agricultural equipment follows planting and harvest cycles.
Layer in economic indicators. Equipment purchases correlate with industry confidence, commodity prices, construction spending, and financing availability.
Use search trend data as a leading indicator. Increases in equipment-related searches typically precede purchase decisions by 60-90 days. This gives you advance warning of demand shifts.
Build simple forecasting models that combine these factors. You don't need sophisticated machine learning. Basic trend analysis identifies most opportunities.
Adjust inventory and advertising strategy based on demand forecasts. Stock up before predicted peak seasons. Increase advertising spend as search interest rises. This proactive approach beats reactive responses to data you're seeing too late.
Group customers by behavior patterns, not just demographics. Some customers research extensively online before contacting sales. Others prefer immediate phone conversations. Some buy multiple pieces of equipment within months. Others make careful single purchases after long consideration.
Analyze which advertising approaches work for each segment. Your analytics might show that construction contractors respond well to model-specific campaigns emphasizing productivity specs. Agricultural buyers might engage better with broader category campaigns highlighting versatility and reliability.
Customize your marketing mix by segment. Don't treat all potential customers the same just because they're all in-market for equipment.
Track segment migration. Customers who start as price-focused buyers sometimes become value-focused buyers as they gain experience. Your analytics should identify these transitions so you can adjust engagement strategies.
Monitor competitor advertising activity. Tools like SEMrush and SpyFu show what keywords competitors target and how their ad spend changes over time.
Track your share of search impressions. Google Analytics and Google Ads reports show how often your ads appear relative to total available impressions.
Analyze win/loss patterns. When customers choose competitors, what drove the decision? Price, availability, financing terms, or relationship factors? Your CRM data contains this intelligence if you systematically capture it.
Use competitive insights to inform strategy. If competitors are reducing advertising spend in certain categories, that might signal opportunity or deteriorating demand. Your broader analytics help you interpret which.
ROAS provides a useful starting point for measuring advertising performance, but equipment dealers need much more detailed analytics to make sound business decisions.
Start by implementing incrementality measurement. Even simple holdout tests reveal whether campaigns create new demand or just capture existing intent. This fundamental distinction changes how you allocate budget.
Connect advertising data to inventory management and customer lifetime value metrics. Your analytics framework should show how marketing decisions affect inventory efficiency, customer retention, and long-term profitability.
The goal isn't more data. The goal is better decisions.
Build measurement systems that answer strategic questions: Which campaigns actually grow the business? How should we balance customer acquisition against customer retention investment? Where should our next inventory dollars go? What customer segments deserve more attention?
Equipment dealerships operating in a market projected to reach USD 227.82 billion by 2035 need analytics that support sustainable growth, not just campaign reporting.
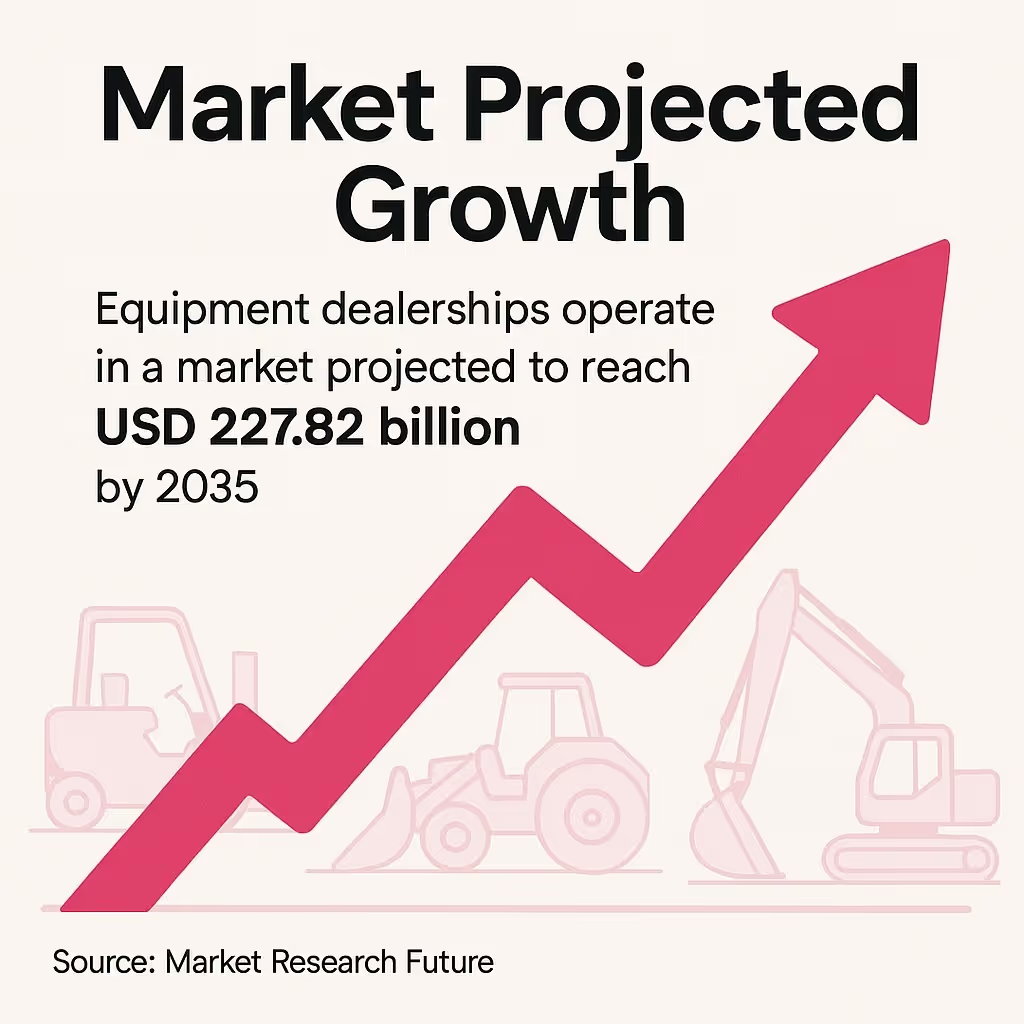
The market is projected to reach USD 227.82B by 2035—prioritize analytics that drive sustainable, incremental growth.
Start small. Pick one metric beyond ROAS to implement this month. Track customer lifetime value by acquisition source, or measure retention rates by cohort, or test one campaign for incrementality.
Add another metric next month. Build your analytics framework progressively. The compound effect of better measurement leads to meaningfully better business outcomes.