.avif)
This is the second in a 4-part series covering our BASE methodology for improving e-commerce PPC Program ROI.
Consider an example. If you’re at the steering wheel of an e-commerce PPC campaign, you need analytics at your disposal. Without a means of collecting, and comprehensively understanding your campaign and store data, you’re driving blind. It will be impossible to reach the desired destination -- more ROI.
You’ll look a little bit like our friend here, Cheech:
Blind (via Giphy)
According to a recent post by Alex Birkett, a growth marketer at ConversionXL, “Being good at analytics is about asking good questions. It’s not about “data puking,” or blindly reporting metrics without questioning their accuracy, integrity, importance, or actionability.”
However, the goal of this article isn’t to convey to you why analysis is important. That’s obvious. Instead, I want to continue our series on the BASE methodology my partner Tom started, and help you better understand how analytics -- internal factors that you can (and should) control -- can improve the ROI of your PPC campaigns. I want you to avoid the traps I see marketers fall into every day.
Onto the first major mistake you may be making!
We’ve said it before, and I must stress it again -- you can’t improve your ROI without knowing where the problems facing you are rooted, and how to address them.
W. Edwards Deming said it best: “You can’t manage what you can’t measure.”

Without a comprehensive system in place to measure what works and what doesn’t, your marketing department might run a little bit like this:
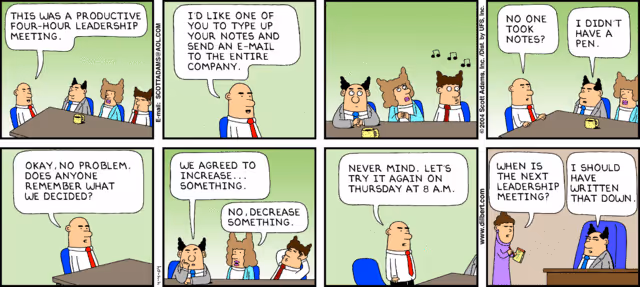
You Can't Manage What You Can't Measure (by Scott Adams)
Disruptive Advertising audited around 2,000 AdWords accounts, and found that 42% had no conversion tracking, 29% had partial tracking, and 29% had good tracking in place.
I’ll continue under the assumption that you have some sort of conversion tracking in place, and that your office doesn’t look like the one from the cartoon.
The next question - is your conversion tracking system setup correctly?
It’s not enough to simply track your conversions. Consider the following scenario:
You own a modern clothing store. A customer comes in, checks out your wares, tries on some items, thanks your staff, and then, leaves. While this shopper was going through the motions, you, as the business owner, were there. You had a chance to ask questions about the customer, gauge their reactions, intents, and make a sale.
That’s a luxury brick and mortar stores enjoy -- online stores don’t have that luxury.
You have to track things thoroughly to get that kind of data from your online shoppers. You have to track more than just your customers’ first and last steps.
See a simplified example of what I mean below:

Sales Funnel With Limited Data (via SCUBE Marketing)
If you’re tracking transactions without the relevant conversion metrics, it’ll be impossible for you to troubleshoot your conversion rate. It’ll be impossible to isolate where your problems lie. Can you tell, for example, if your site has problems with the contact, shipping, or payment steps?
Of course not. Guessing won’t get you very far, either.
To answer this question, let’s take a look at the example with a different scenario, where all steps are tracked, and you know the stats.
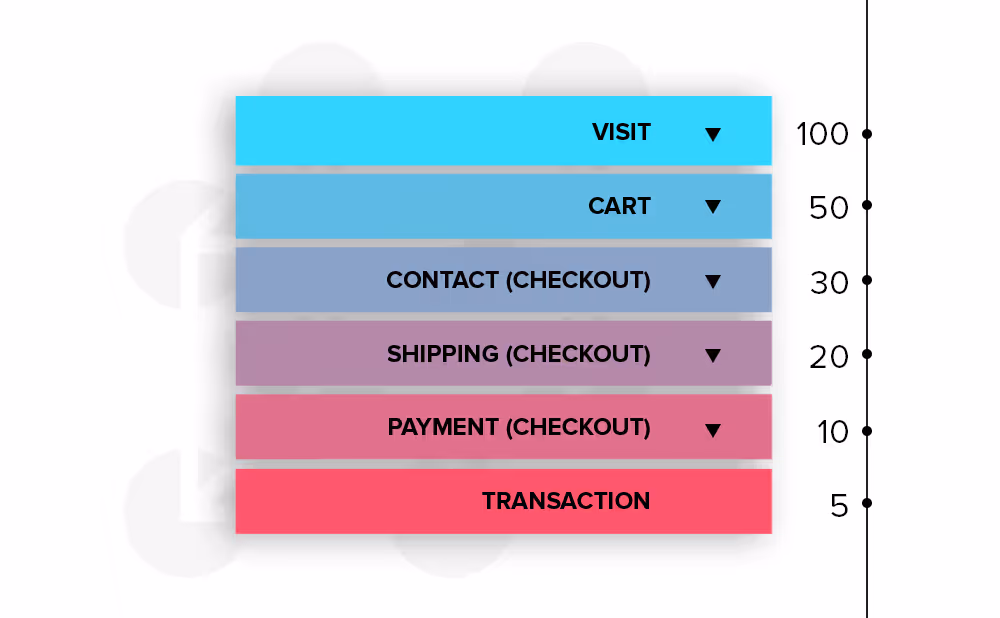
Sales Funnel With Complete Data (via SCUBE Marketing)
Looks nice, doesn’t it? This is your objective -- to set up enhanced e-commerce in your Google Analytics.
Enhanced e-commerce tracking will allow you to see everything that fills in the gaps between the initial visit, and the final transaction.
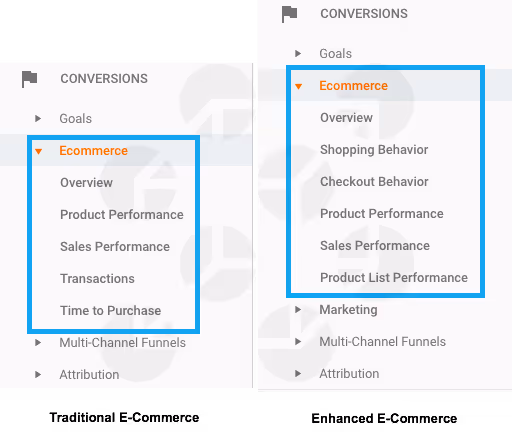
Traditional e-commerce vs. enhanced e-commerce (via SCUBE Marketing)
From the long list of reports available in enhanced tracking, I want to emphasize two that, in my opinion, can make a huge difference in improving your PPC campaign performance:
Shopping Behavior
The Shopping Behavior report lets you see the number of sessions inherent to each stage of the purchase funnel. You'll be able to track how many sessions continued from one phase to another, (a gray transition arrow, screenshot below) as well as measure abandonment at each stage of the funnel (a red arrow at the bottom of a step, screenshot below).
Shopping Behavior Report (via SCUBE Marketing)
Note that users can get back into the funnel at any stage. At the top of a step, this is noted by a blue bar. For example, if a user adds something to their cart during one session, and then completes that purchase during a separate session, the optics would show the user as reentering during the Checkout step.
Checkout Behavior
This report shows you how successfully your users moved through the checkout process. Visualizing the data here is important to understand:
Below is the view of the report:
Checkout Behavior Report (via SCUBE Marketing)
Bonus Reports
I call reports like Product List Performance, Internal Promotion, and Order Coupon “bonus reports.” Each of them provides useful information. However, if your goal is to improve your ROI as soon as possible, I would start with the Shopping Behavior and Checkout Behavior reports first.
Now, here’s how you put it all together, and set it up:
Onto the next major problem related to analytics many are facing.
The customer journey has never been as complex as it is today. Social media, and an addiction to our digital devices, has disrupted the way consumers learn about products. The technology has altered the way customers research, and make decisions about their online purchases.
To better visualize the impact social media has had on the customer journey, let’s review the following example -- customer journey for medium-sized business in the shopping industry.
Based on ThinkWithGoogle, there are 5 touchpoints that influence buyers to purchase.
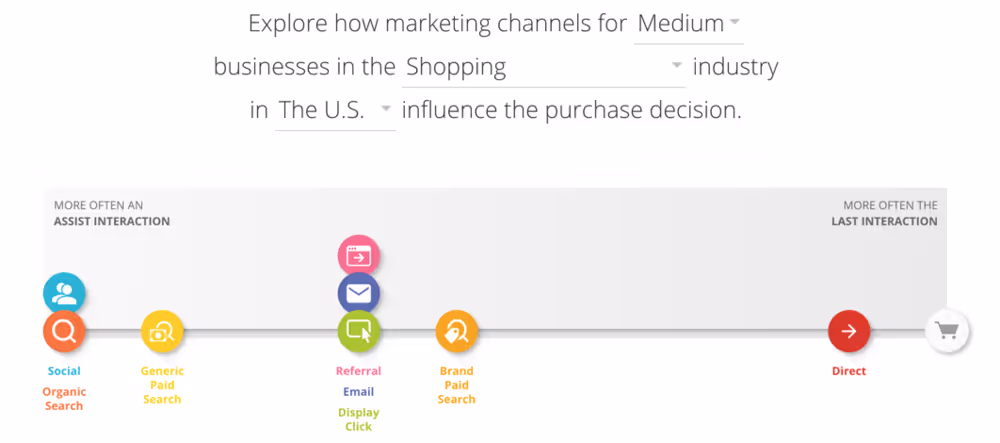
The Customer Journey to Online Purchase (via ThinkWithGoogle)
So, looking at the image, can you easily tell which channel gets the credit? I hope you’re asking:
Based on what attribution model?
My personal experience shows that there is a huge percentage of marketers that use the last click attribution model. Now, if we were using the last click attribution model in the above example, we would give credit only to the Direct touchpoint.
Eventually, we would deem other marketing channels unsuccessful, and scale them down or eliminate them entirely. Is this approach the right one?
To answer this question, let’s take a look at another example: think of a team effort, like racing. When a racecar driver crosses the finish line, is he the sole owner of the credit for the win? Of course not. He had coaches, mechanics, planners, engineers, and lightning-fast pit crews working behind them. His victory belongs to many.
So the answer is no, the last click attribution model is not the right one.
To choose the right attribution model, you need to:
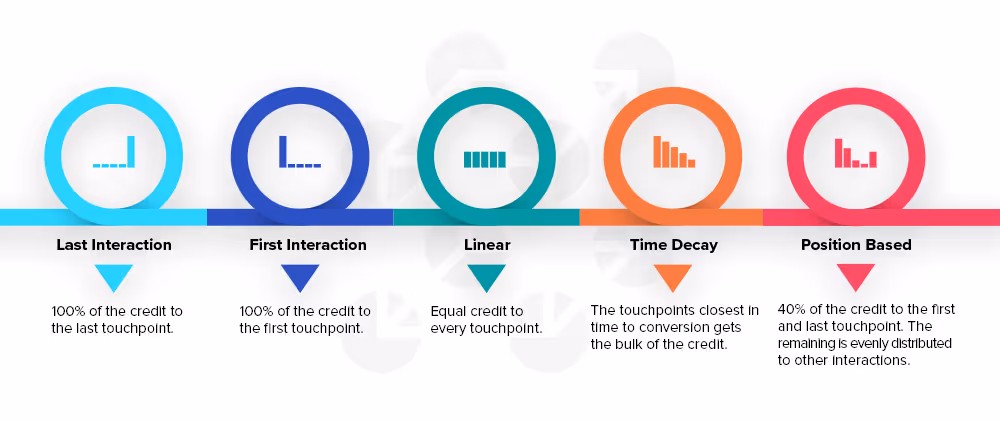
Paid Media Attribution Models (via SCUBE Marketing)
3. Understand middle touchpoints, assisted clicks, and how to use them to make decisions.
The middle of the customer journey doesn’t get the most attention, because it’s hard to decipher how it all relates to a purchase. That doesn’t make it any less essential, though. If you look a the chart below, you’ll see how significant the middle touchpoints are on the path to purchase:

Marketing Channel Impact on the Path to Purchase (via Courtesy Convertro)
Now, assisted clicks are also very important in PPC. These are clicks from a given
keyword that contributed as the first or middle touchpoints leading to a conversion.
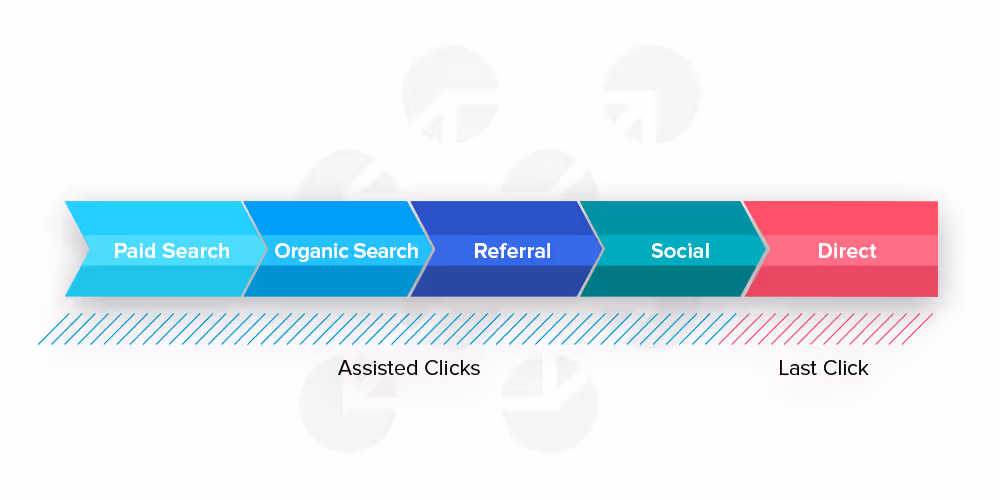
Assisted Clicks (via SCUBE Marketing)
I’ve got an example that might help you visualize the assisted clicks model more clearly.
Let’s say you run a pizzeria with online order & deliver option, and want to evaluate your PPC campaigns.
The click generated by the keyword “half price wings” is the assisted click, and the click generated before the order by the keyword “local NY style pizza” is the last click. Easy peasy.
You can find more information on assisted clicks here.
In practice, the best way to understand the assisted clicks is to look at them from the number of assisted conversions perspective, which is measured by the click assisted conversions metric.
To pull the data, follow these few steps:
Here’s what you should have on your screen:
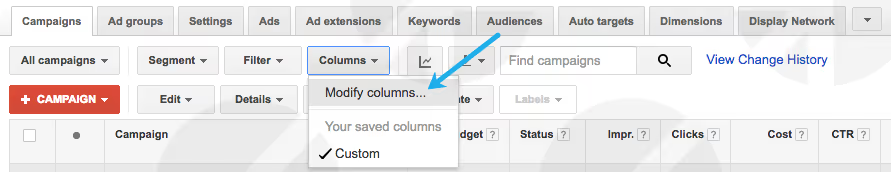
Modified Columns (via SCUBE Marketing
The custom columns available to you depend on the campaign you're running with your account. Here's an example that might show what your columns look like:
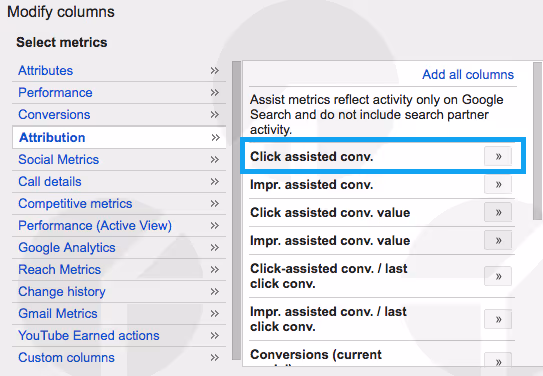
Click Assisted Conversions (via SCUBE Marketing)
As you see, assisted conversions (click assisted conversions) can be found under Attribution, which is a standard metric that should show up regardless of what you're using your AdWords account for.
Here’s the latest news, and it’s something to keep in mind.
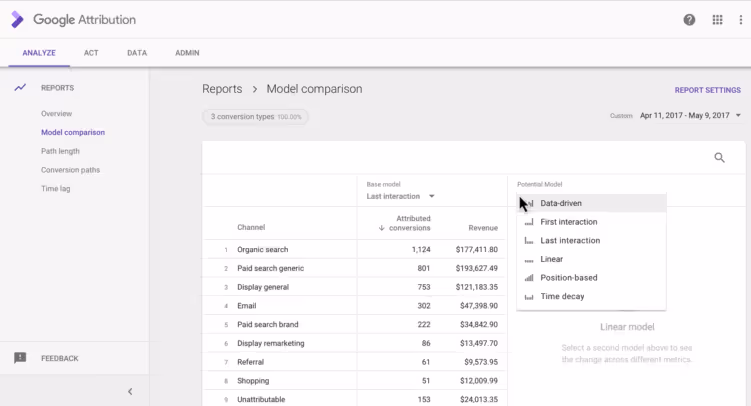
Google recently announced Google Attribution launch. The new, free solution can pull in data from Google Analytics, AdWords and DoubleClick Search to provide a more holistic view of conversion actions across channels and devices for both attribution modeling, and bidding information.
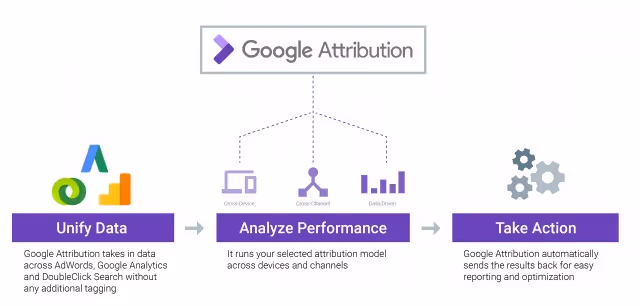
Google Attribution (via Google)
Attribution will use machine learning, according to Google, to assign a weighted value to every touchpoint along a consumer’s path to purchase.
Take a look at the screenshot below.
Google Attribution (Search Engine Land)
Google Attribution is now in beta, and will roll out over the coming months. So, be on the lookout for that
Onto another major problem facing analytics.
Not knowing how your buyers behave, and why they behave the way they do, will keep your conversion rates stagnant. With more competition, and higher CPCs, you’ll have a tough time competing using those rates.
To keep you sane, I’ll focus on one key fact -- 69% of people will abandon your shopping cart. It’s harsh, but true. You just have to deal with it.
A new survey from Sale Cycle found that “74% of online retail visitors who add something to their cart will leave without following through on the purchase.”
As the report reveals, there are different reasons why this is happening:
However, in your case, there can be another reason not listed in the report. Don’t make another mistake by being blind.
First, dig deeper, analyze your shopping and checkout behavior reports, and find problem areas.
For this step, let’s take a look at the examples we discussed earlier, just this time, in a little more detail.
Shopping Behavior report
As I’ve mentioned earlier, this report shows you a detailed breakdown of customers’ journey from the moment they enter your e-commerce store, to the moment they make a purchase.

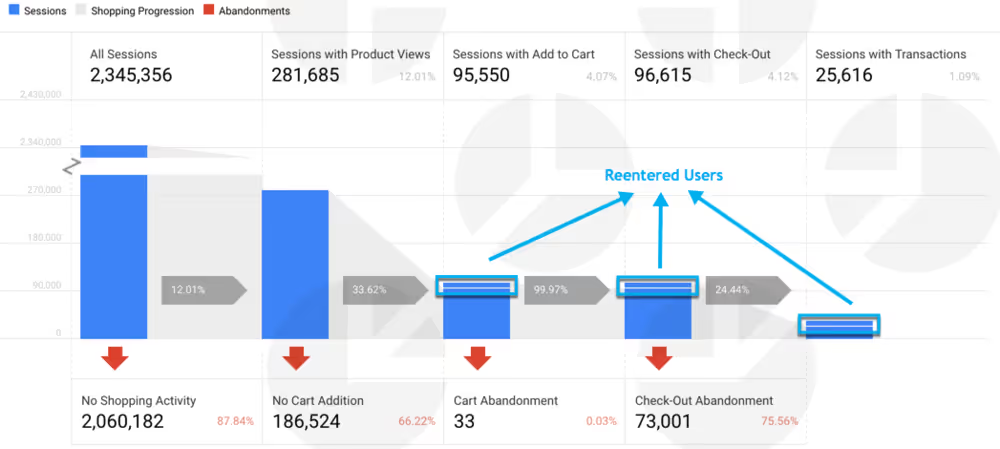
Shopping Behavior Report Analysis (via SCUBE Marketing)
At the top of the report (from left to right), we see all main sessions, along with their performance. What I see right away is that, from 2,345,356 sessions, only 25,616 (1.09%) turned into a sale. The question arises -- why only 1.09%? Where’s the problem?
To answer that question, let’s take a look at the bottom of the report. What do we see?
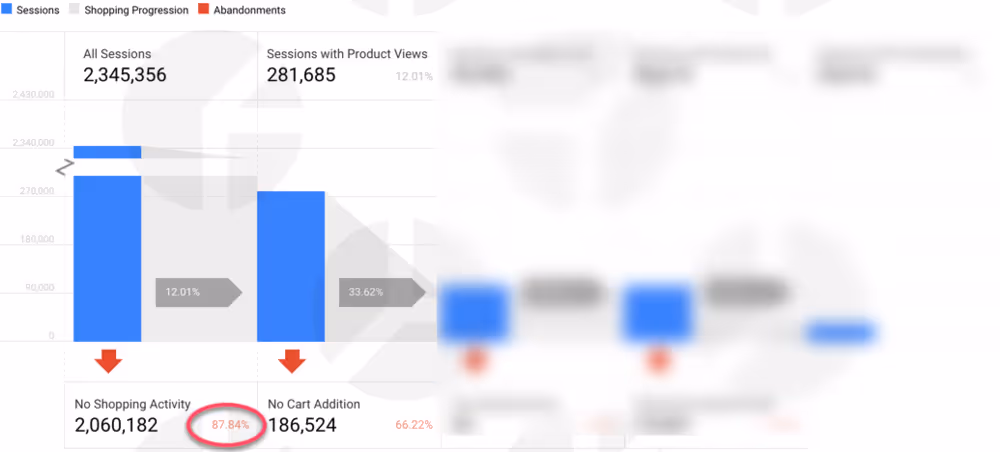
Shopping Behavior Report Analysis (via SCUBE Marketing)
87.84% of sessions have no shopping activity, which means the nature of those sessions was site scanning, and they didn’t lead to further actions. Why did users enter the site and not view the product? Some possible issues come to mind:
Shopping Behavior Report Analysis (via SCUBE Marketing)
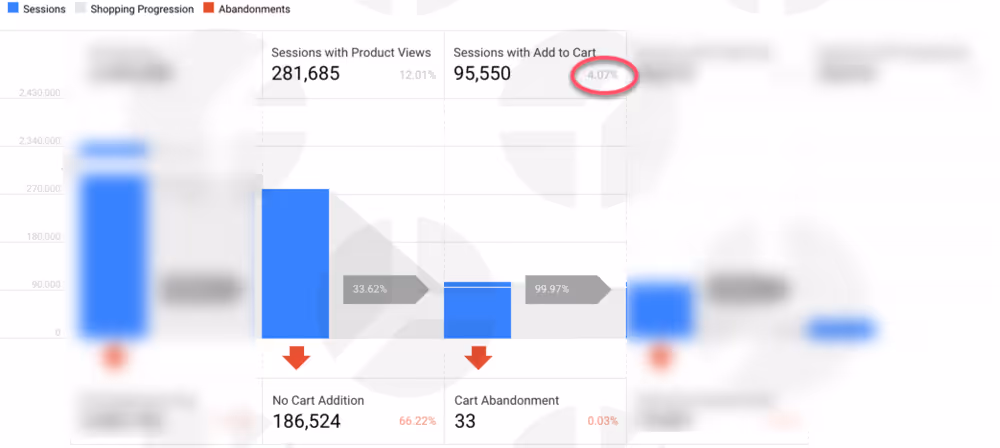
Then, from 281,685 sessions (during which the product page was viewed), only 95,550 sessions (4.07%) moved to the next stage, where the product was added to the cart. What happened to the rest? What could go wrong? Here are some questions to think about:
Shopping Behavior Report Analysis (via SCUBE Marketing)
However, there is some good news -- only 0.03% of “Sessions with Add to Cart” turned into cart abandonment, which means the majority of users, who added the product to cart, moved to the checkout step.
If your numbers are low on this stage, try to answer these questions:
We also need to keep in mind that the most common session expiration time is approximately 30 minutes.
There’s a huge possibility that some users (before going through checkout) might be comparing products and their costs relative to similar products -- and this can take more than 30 minutes. As a result, the session is lost. It’s counted as “incomplete,” and if the user returns in 30 minutes, or in a week, that’ll count as a “reentered” session.
This scenario is perfectly reflected in the “Sessions with Check-Out” column.
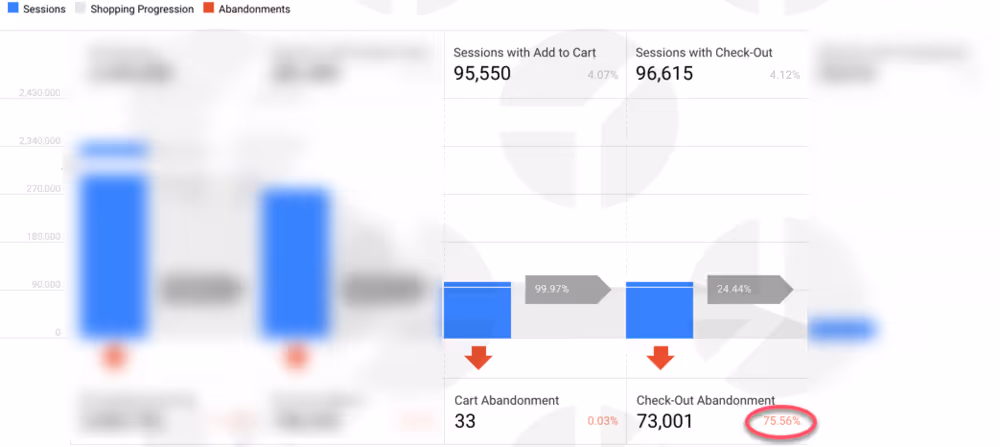
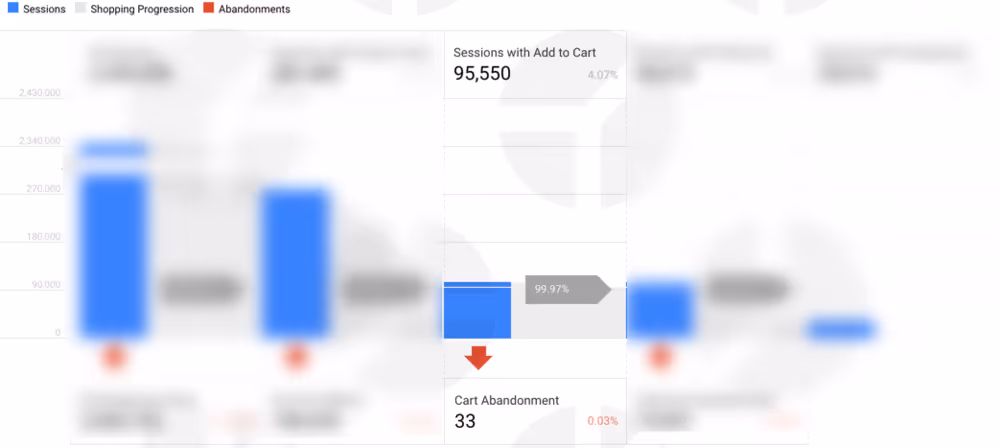
Shopping Behavior Report Analysis (via SCUBE Marketing)
In the beginning, we had 95,550 “Sessions with Add to Cart,” 33 of which became “Cart Abandonment.” At the end, we somehow got 96,615 “Sessions with Check-Out,” when in reality, we should have 95,517. The difference of 1,098 represents reentered sessions, which are the ones I described above.
And finally, we look to the checkout step. Why did almost 76% of customers fail to proceed to the checkout step? We will find it out by analyzing the checkout behaviour report.
Checkout Behavior report
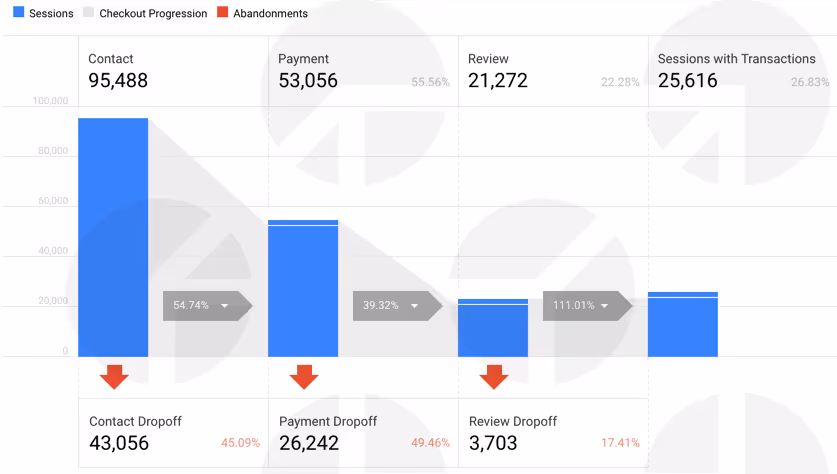
Now, I’ll show you how to slice and dice information about user progress through the checkout processes, including the contact, payment, and review steps, which should answer our question raised above - why did almost 76% of customers fail to proceed to the checkout step?
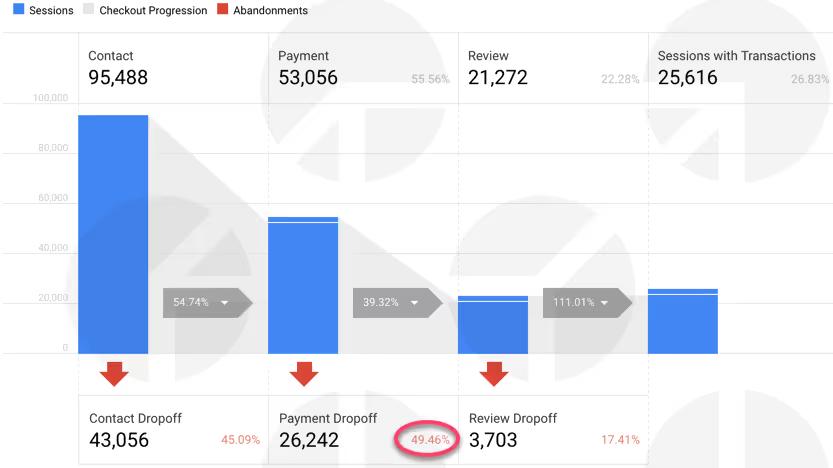
Checkout Behavior Report (via SCUBE Marketing)
If we look at the bottom of each step, we can clearly see that the majority was lost during the payment step. That could happen because of the following:
It’s also important to take a look at other steps, like contact and review. When analyzing these stages, answer the following questions:
Contact
Review
Second, fix the problem areas.
As you can see from my analysis, the shopping and checkout behavior reports show you the concrete data -- each step of the funnel is covered. There should be no more assumptions. The numbers tell the true story, and should be your only guiding light. Once you know where the problem is, make the necessary changes.
Third, and finally, review your stats again to see if there’s improvement.
Note, there's no permanent fix for the problems you'll run into. It's a constantly-changing process that requires you to pay attention to, and address, your customers' pain points. Be patient. Test different approaches, and find the one that really works.
You can't say things aren't working out for you until you've isolated and fixed every last internal factor (the things you can control). If you haven't been thorough and addressed those issues in full, you have a lot of work to do before you can throw in the towel.
Collecting and analyzing data, while presenting its own unique set of challenges, is something you most decidedly can, and must, control. Don't shy away from trial and error, or especially from the hard data and questions related to it.
In the long run, doing so will make running your PPC campaigns, and optimizing your ROI, a lot less of a hassle.
Be proactive -- take the wheel. But pay a little more attention than our friend, Cheech, does.